Thursday, May 31, 2018

Interesting Maps: Worldwide Risk, South China Sea, Hurricanes And The Arctic

Lots of interesting maps out there these days.  Here are a few that tell their stories better than most...

Marsh is a insurance broking and risk management firm with a pretty long track record.  Founded in 1871, you have probably never heard of them because they work with big companies to help them figure out their insurance needs.  They do about $6 billion a year and have upwards of 30k employees in 130 countries. 

What I like about them is that they put a lot of their research online.  Obviously, all of it has an insurance "edge" to it (that is probably less exciting than it sounds, by the way) but you don't have to wade through a ton of small print to get to some meaty stuff on just about any region of the globe.

Which is why their Political Risk Map is so interesting.  You can take a look at a screenshot of part of the map below but to find out what all the pretty colors mean and to see the rest of the world, you are going to have to go to the site itself.


Marsh Political Risk Map
Drilling down into just one part of the globe - in this case, the South China Sea and environs - requires a more nuanced view of risk and there are a few, very good, recent, mapping tools to help make sense of it all. 

The first was put together by the Asia Maritime Transparency Initiative.  AMTI is housed within the highly regarded Center for Strategic and International Studies and offers a substantial body of analysis on issues in and around the South China Sea.

Particularly impressive is the map below (just a screenshot - click the link for the interactive version) that lays out all of the claims and counterclaims to various chunks of ocean in the area.

AMTI Maritime Claims Map
Equally impressive is the very detailed and highly interactive reporting done by the talented people at Reuters Graphics.  Their article, Concrete and Coral is an excellent primer for those not familiar with this hotspot.  I have taken a screenshot of one of the many graphics but it does not do the article justice.  You really have to see it to get the full effect.

Concrete and Coral
One more hotspot and one more map!  This time it is the Arctic Sea, which, because of ice loss due to climate change, has become yet another slowly growing crisis.  While much of this crisis revolves around resource extraction and which country owns what, it is worth noting that there are a lot of people who make this part of the world their home as well.

GRID-Arendal was formed in 1989 in an agreement between Norway and the UN.  In their own words, "We transform environmental data into credible, science-based information products, delivered through innovative communication tools and capacity building services."  Their maps (and the accompanying text and data) on indigenous people in the Arctic Circle certainly accomplishes this goal.  Again, I provide just a screenshot of one of the many maps and resources they have provided below.  Check the entire site for more!

Indigenous Peoples Of The Arctic
Finally, as most Americans (particularly those in the south) know, it is hurricane season again.  Many areas are still trying to recover from last year's devastating series of hurricanes and the good people at NOAA are already saying that this year is likely to be as bad or worse.

NOAA provides a very cool interactive mapping tool that let's you examine historic hurricanes and their tracks in a number of different ways.  I was curious, so I set out to find how many hurricanes had impacted the Erie, Pennsylvania area (where I live)  Much to my surprise, there were five since 1955!  Check out the full site to search for your home town.

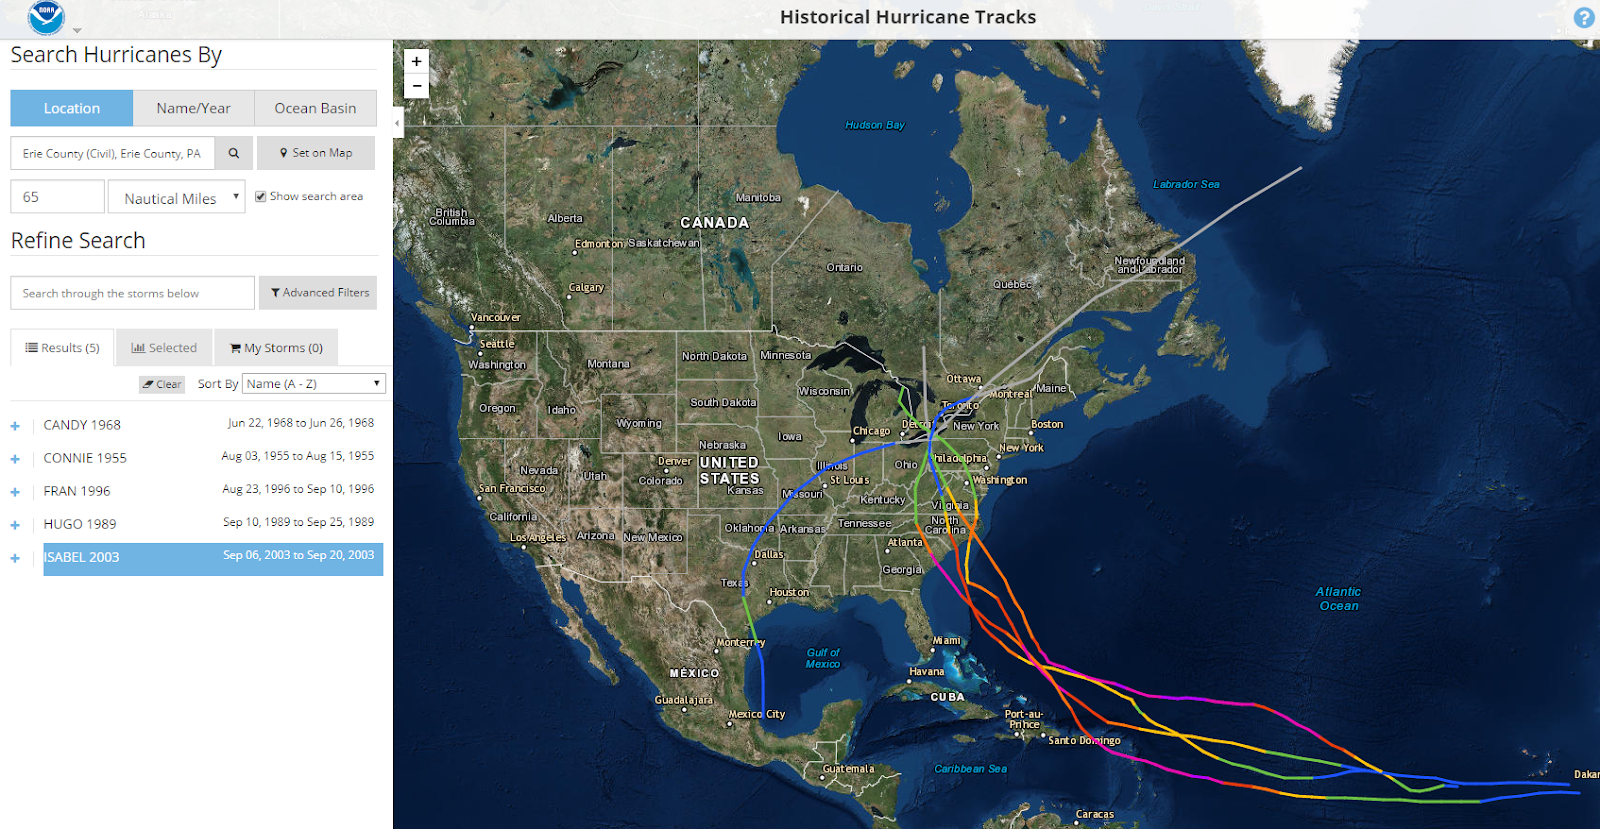
NOAA Historical Hurricane Tracks


Wednesday, August 30, 2017

Dax Norman Just Passed Away And That Is An Enormous Loss. Here's Why.

Dax Norman died on August 20, 2017.  My deepest sympathy goes out to his family.

I called Dax a friend but, as happens sometimes, we had not had a chance to speak for quite a few years.  

I do know, however, he was a good man.  Don't take my word for it; just check out the many comments that have already been added to his obituary.  All the things that people say about him - that he was a gentle man, that he was kind and generous, that he willingly gave his time, that he was an excellent teacher and mentor - are all true.

For those of us who teach and think about intelligence analysis, however, he was more.  He was one of the best thinkers I knew on how intelligence should work.  

I met Dax shortly after I got out of the Army in 2003.  He was looking for a University to do some unclassified research on technology trends and Mercyhurst wound up with the contract.  While not a huge contract, it was large for us back then.  It also started a multi-year relationship with the US government that helped many students test and hone their skills as junior analysts.  Any Mercyhurst grad who ever spent any time on one of the so-called "summer projects" owes that experience either directly or indirectly to Dax.

Dax made innumerable contributions to our national security in his decades working for the government.  One of these contributions that I always found most significant is the work he did on open source credibility back in 2001.  Facebook did not even exist back then and Dax was one of the few thinking about the problem that we call today "fake news".  More than just think about it, though, Dax came up with a rigorous system for evaluating the credibility of online sources long before anyone even thought that they needed such a thing.  His work is still online for anyone who is interested.  For Mercyhurst students, of course, it has been modified and enshrined as the much beloved (?) online source evaluation sheet that accompanies each and every online source used in our reports.

I have more stories, of course, and others will tell theirs as well.  The long and short of it all is that Dax was one of the good ones.  There aren't enough Daxes in the world and he will be missed.  

If you knew him, you can post your thoughts or memories on an online sympathy wall.  If you are in the DC area there will be a service on 6 SEP.


Monday, August 28, 2017

RFI: Looking For Descriptions Of The Intelligence Process

I am looking for relatively recent, short descriptions of the intelligence process from as many different sources as possible.  An example (from US Joint Publication 2) of the kind of thing I am looking for is in the image to the right.  

I am NOT looking for images, just descriptions.  My first preference would be from official (public, obviously) documents but I will accept anything that has been published.  

I don't care what language it is in.  In fact, I would LOVE descriptions of the process from other countries or disciplines (e.g. Law enforcement or business).  You can attach the sources in the comments to this post or send them to me at my university email (kwheaton at mercyhurst dot edu). Please do not hesitate to share!

Thanks!

Monday, March 13, 2017

Learn IMINT? Stop Looting? Yep, It's Been A Good Day!

Can you see the signs of antiquities looting in the picture to the right?

I think I can.  Left of the main road there appear to be three looting pits.  I also think I see some more pits to the right of the road at the base of the first row of small hills.  They might be vegetation but the shadowing and the distribution suggest looting - at least to me.

How did I learn to spot looting pits?  I joined the GlobalXplorer Project!

Here's how National Geographic's GlobalXplorer Project describes itself:
"GlobalXplorer is an online platform that uses the power of the crowd to analyze the incredible wealth of satellite images currently available to archaeologists. Launched by 2016 TED Prize winner and National Geographic Fellow, Dr. Sarah Parcak, as her “wish for the world,” GlobalXplorer aims to bring the wonder of archaeological discovery to all, and to help us better understand our connection to the past. So far, Dr. Parcak’s techniques have helped locate 17 potential pyramids, in addition to 3,100 potential forgotten settlements and 1,000 potential lost tombs in Egypt — and she's also made significant discoveries in the Viking world and Roman Empire."
In order to accomplish this mission, the GlobalXplorer Project puts you through a brief  tutorial that teaches you how to spot looting of archaeological sites.  It then unleashes you and other members of the project onto a dataset of thousands of satellite photographs of Peru like the one above.  

Your answer to the question "Is there looting going on in this picture?" is then compared with hundreds of other answers from different people looking at the same picture.  Pretty quickly the crowd forms a consensus that allows project managers to focus scarce local enforcement and preservation resources.

GlobalXplorer, like the Satellite Sentinel Project and other non-profit efforts, takes advantage of aerial imagery and imagery analysis techniques formerly familiar to only highly trained intelligence professionals.  In so doing, GlobalXplorer also creates an excellent tool for exposing intelligence studies students to some of the tradecraft of the modern imagery analyst.

I recently used the project in precisely this way in a class I am teaching called Collection Operations for Intelligence Analysts.  The course is designed to expose analysts to the difficulties inherent in many modern collection operations.  My hope is that by knowing more about collectors and what they do, the students will become better analysts - and maybe catch a few grave robbers in the process!

Friday, March 3, 2017

Another Color of Hope - Chapter 2 Now Available (Free!)

Another Color Of Hope, for those of you who missed it the first time around, is a "choose your own adventure" style intelligence training game that I have been developing.  I use a free development platform called Twine to create this work of - as it is known formally - interactive fiction.

I have been wanting to design a game to teach or, at least, introduce a particular intelligence analysis method to my students for quite some time.  Interactive fiction seemed to be a good way to create a more engaging environment for learning this particular method.

I am being a little coy here about which analytic method I am trying to teach on purpose.  Part of what great games do is teach without teaching.  Much of the learning is baked into the the gameplay in such a way that the student/player doesn't necessarily know they are being taught.  Much of my research into game-based learning suggests that this is far more difficult to do than you might expect but I thought this experiment was worth the effort (I do think it is pretty obvious which method I am trying to teach by the end of Chapter 2, though...).

If you have not played Chapter 1 you can access it here:

Another Color Of Hope (Chapter 1)
(And you can leave a review of the chapter here.)

And you can access Chapter 2 here:

Another Color of Hope (Chapter 2)
(And you can leave a review of it here!)

Don't hesitate to share both chapters with others and feel free to use them in class if you think they are helpful!