Monday, February 3, 2014

Turkey Redrawn: Ethnolinguistic Lines And Populations In Transit (Part 2 Of A Multi-Part Series)

Note: This is the second part in a multi-part series covering an extensive project on the human geography of Turkey and network analysis applications within the field of Intelligence Studies. Be sure to read the first post, My Conversation With The Free Syrian Army!


Turkey’s ethnic populations are, in a word, surprising. 

For example, one would expect that speakers of Azerbaijani residing in Turkey would speak Northern Azerbaijani from Azerbaijan.  Yet, according to Ethnologue, the Azerbaijani spoken within Turkey’s borders is Southern Azerbaijani from Iran. This begs the question: are the ethnic Azeris in Turkey from Azerbaijan or Iran? Or both? Of course, all Azeris are ethnically Iranian, and Northern and Southern Azerbaijani are mutually intelligible as far as languages go, but the fact remains that many many Azerbaijanis living in Turkey did not originate where the name suggests. 

The same is the case for the Kyrgyz speakers in Turkey who did not immigrate from Kyrgyzstan but were resettled in Turkey’s Kars province from the Wakhan Corridor of Afghanistan after migrating into Pakistan through the Hindu Kush in the early 1980s. 

Surprised? I'll admit that I was. 
Figure 1. Turkey Provinces by Population
Figure 2. Philippine Languages Map

When analysts look at a country, they tend to look at the lines that divide it. International borders, provinces, districts, regions, counties, states.  They serve as the architecture for how we come to understand a region in a defined geographic space. Turkey, for example, is a country comprised of 81 provinces and 957 districts (See Figure 1) that also plays host to the largest portion of the frequently-imagined Kurdistan in the southeast.

The human geography of Turkey, however, maps a different landscape than that dictated by provincial borders. Borrowing an idea from a Philippine Science blog (See Figure 2), I set out to make my own linguistic map of Turkey (See Figure 3). This map depicts an ethnolinguistically diverse country hosting five language families, over 30 living languages and over 30 minority ethnic populations (for a quick dive into Turkey's linguistic diversity, check out Ethnologue's Turkey page).
Figure 3. Linguistic Map of Turkey 
Figures 4 and 5 overlay these social and linguistically driven borders - borders which are truly more reflective of the internal population. Equally as important as recognizing these borders is understanding how they came to be the way the are (I again reference the resettlement of the Kyrgyz from Afghanistan). 

Figure 4. Ethnolinguistic Areas of Turkey


Figure 5. Ethnolinguistic Areas of Istanbul

What began as a geocultural mapping project of Turkey to fill a void in geospatial intelligence quickly evolved into population movement simulations referencing arguably the most prominent humanitarian crisis of today: The Syrian civil war. 

Why? 

Because no competent analyst can submit a report on minority ethnic populations of Turkey without at least mentioning the approximately 1 million Syrian refugees flooding into the country over the last 12 months (Hatay province was always a microcosm of Syria in Turkey; now that can be said for practically the entire southeastern border ... but more on that later). 

The point is that the population movement simulations were only possible with a comprehensive understanding of Turkey's ethnographic landscape in the form of a map which, surprisingly, did not exist prior to the undertaking of this project. 

Did any ethnolinguistic maps of Turkey exist? Sure. See Figures 6 and 7 for some of the better examples. But what did they use for resources? How comprehensive were they? How dated were they? These were the questions I asked myself before starting my own collection. 


Figure 6. Kurdish Language Map
Source: Geocurrents, a fantastic geolinguistics blog
Figure 7. Turkish Language Map
Source: Muturzikin, a Basque Linguistic Mapping Resource
To create my map of Turkey, I went to places some analysts would never go in the name of high source reliability: Blogs. Conducting an Internet deep dive, I looked at independent travel blogs (such as MiddleEastExplorer), organizations seeking to spread Christianity to non-Christian areas (such as The Joshua Project) and a host of sites for endangered languages and minority peoples (like Sorosoro and Linguamon). After all, a small Russian news organization covering a film crew's recent travel to Turkish Tatar villages to research an independent film, Halkim Minem, is as good a source as any to use to identify Tatar villages within Turkish borders. 

Using over 200 resources, albeit many with low source reliability, and taking all pre-existing ethnic maps of the region into consideration, I vetted, corroborated, re-vetted and combined everything I could find on all 30 ethnolinguistic groups in order to compile the most comprehensive and up-to-date ethnolinguistic map of Turkey currently available. 

Making an ethnolinguistic map of Turkey was my way of walking the battlefield in preparation for the bulk of the project, the simulation, which was yet to come. 

Next: Borrowing Analytic Techniques: Populations, Predictions And What Physics Tells Us About The Movement Of Alawites.


***

Below are some of the other maps generated throughout the ethnolinguistic mapmaking process. These maps provide ways of looking at the dynamic fluctuation of identified ethnolinguistic areas.
Ethnolinguistic Groups in Turkey According to Origin of Group.
Internal (from within Turkey) - Purple
External (Such as immigrant or diaspora) - Blue
Ethnolinguistic Groups in Turkey According to Direction
Expanding group - Green
Neutral group - Yellow
Decreasing group - Orange
Ethnolinguistic Groups in Turkey According to Language Status (Scale Provided by Ethnologue)
3 - "Wide Communication" - Dark orange
  4 - "Educational" - Light orange
5 - "Developing" - Yellow
6 - "Threatened" - Light green
7 - "Shifting" - Dark green

Tuesday, January 28, 2014

My Conversation With The Free Syrian Army (Part 1 Of A Multi-part Series)

Bayramtepe, Tekirdag, Turkey
I was sitting cross-legged on the floor of a two-room apartment filled with floor cushions and a series of bunk beds. Fifteen men between the ages of 22 and 30 stared back at me, some having just woken up, some smoking cigarettes, some waiting intently for me to speak, others merely staring off into the distance. Personal weapons were strewn around the room along with some clothes, everything from dirty socks to handguns.

If this were a chance encounter, I would have said all 15 of them were just like me. But that couldn't have been further from reality.

None of the men knew each other before coming to Bayramtepe (a little town approximately three hours west of Istanbul) from Syria. They all had different stories regarding how they came to be there. Six of them had jobs in factories. The others did not work. Some were from Golan Heights, others from Damascus, Latakia and Aleppo. Some had been in Istanbul for just a month where others had been there upwards of a year.


Bayramtepe, Turkey
They were former fighters in the Free Syrian Army (FSA), one of the leading opposition forces in the ongoing Syrian civil war. About half of them had defected from the Syrian military in order to fight with the FSA. All of them had given up the fight - at least for now. And all of them were in Istanbul hoping to find work.

What led me to Turkey is a long story about simulating refugee population movements, network analysis techniques and a distinct focus on the human geography of Turkey. Over the next several posts, I will seek to elaborate on the projects, the methods and the experiences that span the Syrian civil war and the role of social network analysis in intelligence analysis.

This first post, however, is about the people I met.


***


"What was a normal day like for you?," I asked.

A man who had been with the FSA the longest answered in broken English, "We mostly fought Hezbollah in Damascus. They were our main opposition. We lived normal lives, generally. Wake up, eat something, but sometimes, most days, we had to fight."

"Do you think you will ever go back to Syria?," I continued.


A shorter man with large green eyes who spoke the best English replied, "When al-Qaeda leaves, I will go back!"

Another man piped up from the corner in Arabic. 

"He says he could care less about al-Qaeda, but when Assad is gone, he will once again return to Syria," my translator told me.

The men all laughed.

"What did they say now," I asked.

"That you should deliver the message to President Obama," my translator replied.


***


These are only a few of the people and only one of the encounters that occurred during my recent trip to Turkey to interview Syrian refugees in the outskirts of Istanbul. A collector of stories, I spoke with 20 families and over 100 individuals in just three days, including defected Syrian military fighters, the directors of two independent Syrian refugee organizations, self-identified members of Al Qaeda as well as the Free Syrian Army fighters mentioned in this post. 

We told part of the story in our most recent article, The Potential Of Social Network Analysis In Intelligence, which we published online in the e-International Relations magazine and OODALoop

But there is much more.  


Next:  Turkey Redrawn: Ethnolinguistic Lines And Populations In Transit

Monday, January 27, 2014

Strawman - Or How I Read A Gamebook (That's Right - A Gamebook) And Became A Less Biased Analyst

http://www.amazon.com/Strawman-Kristan-J-Wheaton-ebook/dp/B00HG3XN6W

"A madman is on the loose! Can you play his mind games and win? Can you catch him before he strikes again?"

That is how my co-author, Mel Richey, and I introduce our new gamebook, Strawman (now on sale at Amazon).  It's part adventure novel, part game, and part teaching tool.  

Let me break that down for you a bit...

Inspired by our work on the Intelligence Advanced Research Project's Activity's SIRIUS project (you know, the one where they are trying to build video games to teach analysts about cognitive biases?) and our colleagues on the Boeing team, Mel and I decided to try to do something similar.  

We didn't have the kind of money necessary to design a video game so we decided to write a "gamebook".  What's a gamebook, you ask?  Well, some people call it "interactive fiction" but most people remember it as the old "choose your own adventure" style book.  This format forces readers to make decisions and enjoy success or suffer the consequences as they move through the story.  Strawman, for example, has eight possible endings, depending on how well you do in each scenario.

Recently made popular again by the phenomenal success of Ryan North's To Be Or Not To Be gamebook, this format is also perfect for a guided learning experience. 

That's right!  Wrapped up in the middle of this adventure story filled with spies and terrorists and mad bombers, are lessons about how cognitive biases affect our judgement and decisionmaking.  In fact, understanding these lessons are crucial to the reader's success. Each scenario hinges on the reader's ability to spot the bias and to take corrective action in order to successfully move the story forward.

Don't get me wrong - there is nothing artificial about our scenarios.  We built each of them around real world incidents where bias was the cause of intelligence failure or around experiments where bias was successfully elicited.  

Strawman only covers three of IARPA's "Big Six" cognitive biases:  Projection, Representativeness and Anchoring.  The other three biases will have to wait for volume 2...

In addition to teaching readers how to recognize these three biases "in the wild", however, Strawman also teaches a way to mitigate their effects.  Through a series of guided exercises, we try to teach the reader to be able to put him or her self into someone else's shoes - to see the situation from the perspective of the other guy.  While this approach will not make up for facts that are missing from an analysis, we believe that it will help analysts weigh the evidence they do have more accurately.

We tried to write Strawman at an advanced high school or early college level but we have been pleasantly surprised at how many of our reviewers on both sides of 20 really enjoyed the book. Here are a few of their comments:
“Recognition of cognitive bias in one’s own thinking as well as in others is a key skill for effective analysis. New and imaginative methods for teaching this skill, such as Strawman, are badly needed.” -- Richards J. Heuer, Jr., Former CIA Analyst, author of The Psychology of Intelligence Analysis 
"What I like the most about Wheaton and Richey’s Strawman is that, even though it’s billed as a choose-your-own-adventure style gamebook, it actually feels a bit like a videogame, as it introduces readers (players?) to three psychological biases through a set of early missions that lead into the main story, like a good set of tutorial levels for a videogame. Also like a good videogame, Strawman’s story ingeniously provides an in-game piece of hardware to help scaffold player learning, helping readers see situations from different perspectives. This crutch is taken away for later missions, making for a nicely-designed difficulty curve. Meanwhile, readers are drawn into a compelling story arc that builds steam and brings it all together with a satisfying final mission that’s straight out of NCIS or 24." -- Mark Chen, Author of Leet Noobs: The Life And Death Of An Expert Player Group In World Of Warcraft 
“An innovative, engaging read. With its unusual format and accessible writing style it’s perfect for high school or college crowds all the way up to professionals in the field. If you’re interested in cognitive bias, Strawman will teach you how to identify and how to eliminate it.“ --Josh Klein, hacker, author of Reputation Economics: Why Who You Know Is Worth More Than What You Have and host of NatGeo's The Link 
"Strawman is a must read for all entry level intelligence analysts, in any area - military, government or industry. Mel Richey and Kris Wheaton have produced a very interesting and eminently sensible approach to learning about the perils of cognitive biases and the adverse effects they can have on decision-making. Moreover, those who teach intelligence will find that Strawman helps them bring new and profitable excitement to any class." -- James S. Cox Ph.D. Brigadier-General (Ret'd), Vice President, Academic Programs, Canadian Military Intelligence Association
Strawman is currently available for download at Amazon's Kindle Store.  Don't have a Kindle?  No worries!  Amazon has free Kindle Reader Apps for almost every device, including PCs, smartphones and tablets.  

We hope you enjoy Strawman!

Thursday, January 23, 2014

The Potential of Social Network Analysis in Intelligence

(In case you missed our most recent article over at e-International Relations or at OODALoop, we are reprinting it here!)

The legality of the National Security Agency’s (NSA’s) use of US citizens’ metadata to identify and track foreign intelligence organizations and their operatives is currently a subject of much debate.  Less well understood (and consequently routinely misreported) are the capabilities and limitations of social network analysis, the methodology often used to evaluate this metadata.

One of the first causes of confusion is definitional.  Social network analysis is often linked to an inappropriate degree with social media.  True, social media such as Facebook and Twitter are frequently used as rich data sources for social network analysis, but understanding the importance of networks in the affairs of states has been around at least since Machiavelli.[1]
In addition, the first modern version of what would come to be called social network analysis was developed not by an intelligence agency or computer scientist but by Columbia professor and psychosociologist, Jacob Moreno, in 1934.  These “sociograms,” as Moreno called them were used to graph individual preferences or relations within a small group.
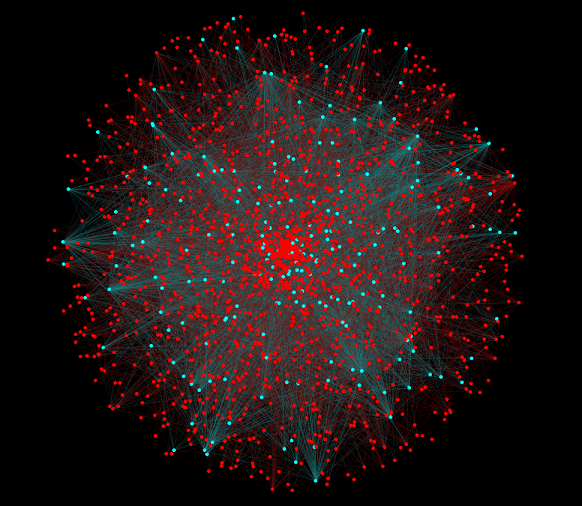
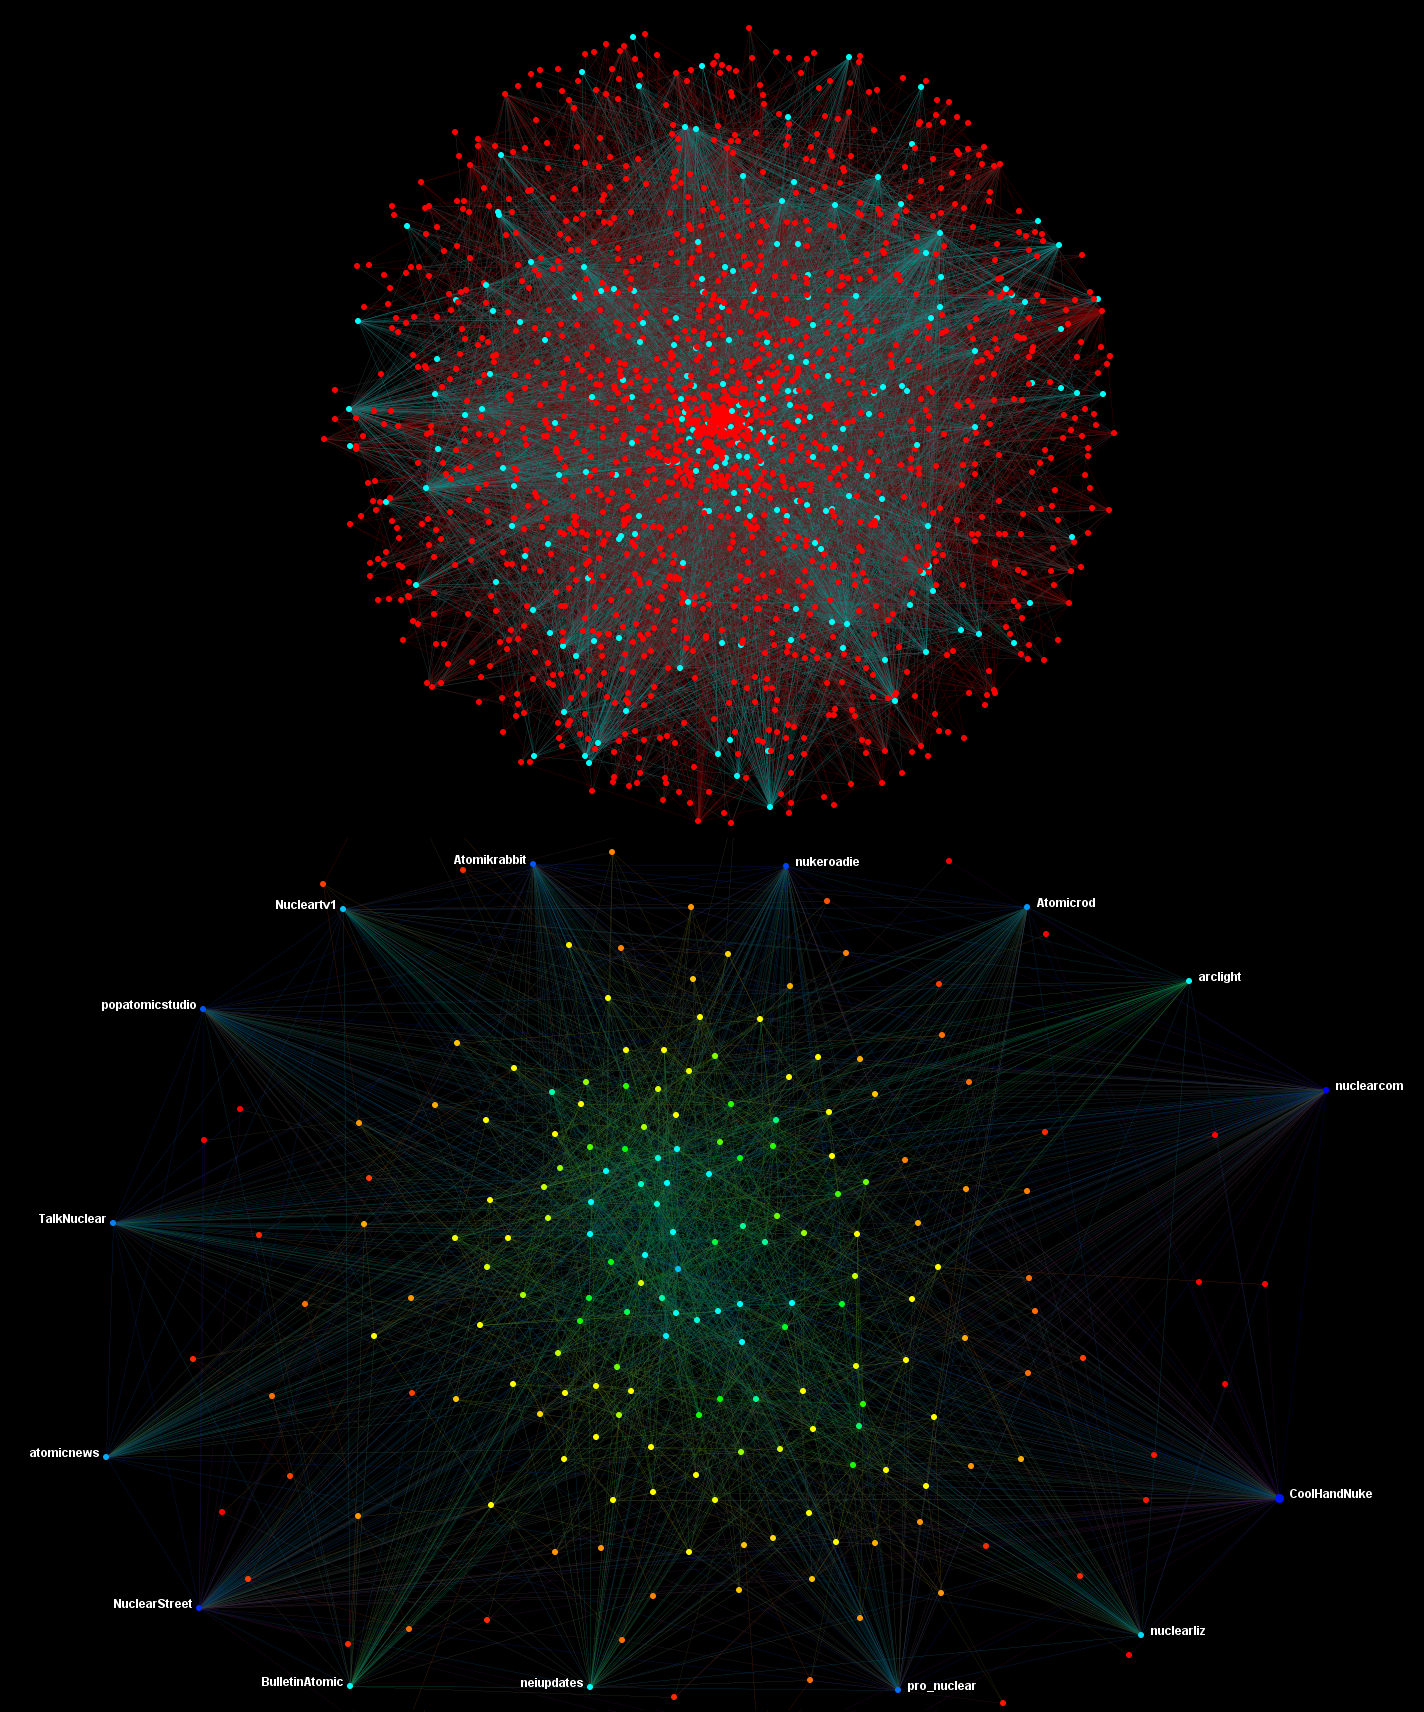
Little did Moreno suspect that his method for understanding the relationships between people, when combined with graph theory and the processing power of computers, would allow for the detailed analysis of thousands of people or organizations with hundreds of thousands of connections between them (See Fig. 2). [2]

Figure 2 – Modern social network analysis uses powerful computers and graph theory to map out the relationships between thousands of nodes and hundreds of thousands of links. Shown here is the network of the over 6000 Twitter users who follow the Twitter handle of the American Nuclear Society along with their over 200,000 connections. (Image Source: Melonie Richey)
Along with the undeniable power of this type of analysis comes the inevitable (and justified) concerns for privacy and constitutionality.  But just how powerful is social network analysis?  What can intelligence agencies actually glean from the exabytes of data they are purportedly collecting?
Social Network Analysis, as an analytic method, has inarguable applicability to the field of intelligence and is progressively reshaping the analytic landscape in terms of how analysts understand networks. For example, analysts currently use SNA to identify key people in an organization or social network, develop a strategic agent network, identify new agents and simulate information flows through a network. Beyond this, SNA can be easily combined with other analytic practices such as Geographic Information Systems (GIS), gravity model analysis or Intelligence Preparation of the Battlefield (IPB) to create robust, predictive analyses.
Identifying Key People/Organizations in a Network
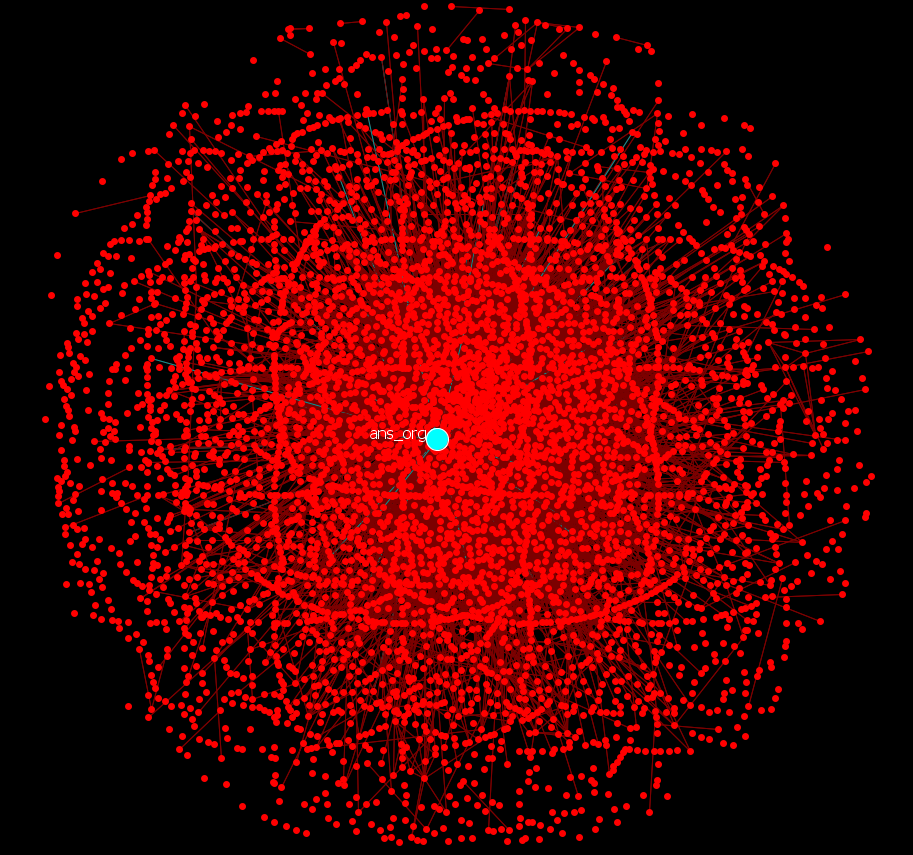
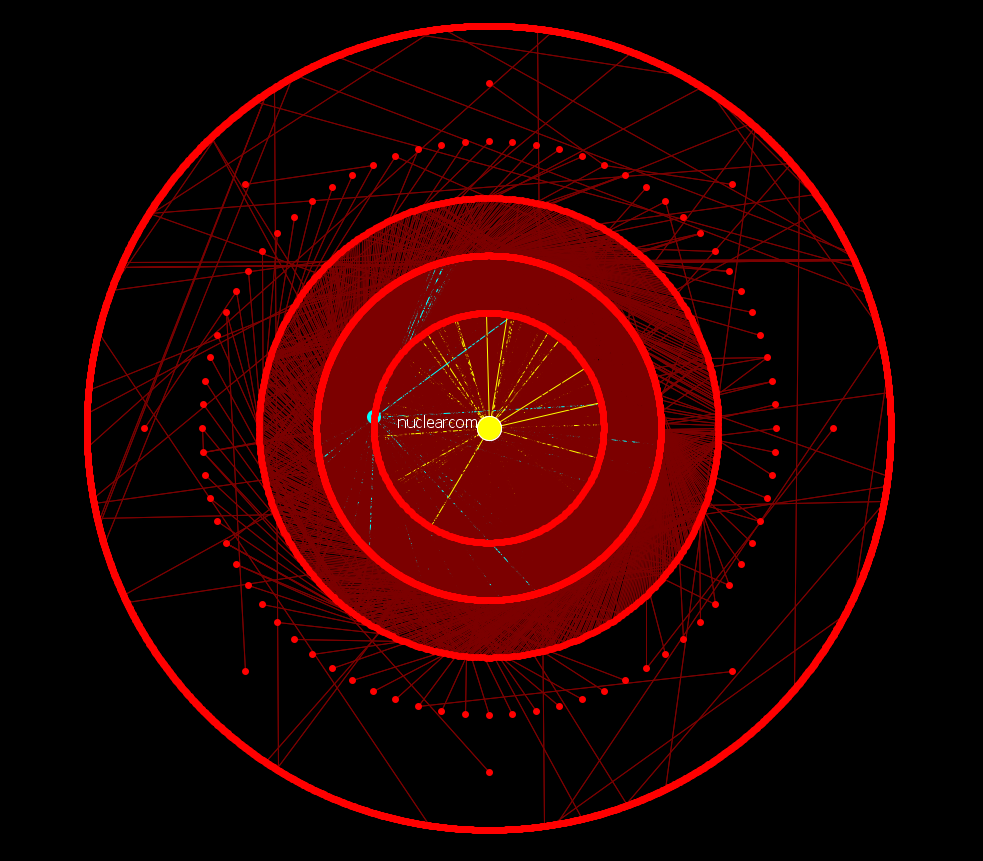
The most obvious use of SNA is its ability to identify key actors and entities within a network. Centrality measures within a network are means for measuring a node’s relative importance within the network. [3] It is well-accepted that “the ability to measure centrality in social networks has been a particularly useful development in social network analysis.”   What is more interesting, however, is the number of centrality measures that social network analysts use to reveal different things about how key actors interact within a network. [4] For example, a node with a high degree centrality is connected to many other nodes. In Figure 3 below, it is unsurprising that the American Nuclear Society (ANS) has the highest degree centrality in its own Twitter network.  However, a node with a high betweenness centrality is one that connects the cliques in the network.  Figure 4 shows the same ANS network, reconfigured and revisualized with an emphasis on betweenness, with a new node, Nuclear.com, emerging as the most important.

Figure 3 (Image Source: Melonie Richey)

Figure 4 (Image Source: Melonie Richey)
For example, by analyzing the network in accordance with different centrality measures and establishing filtering criteria (and using Carnegie Mellon’s ORA software), [5] we were able to reduce a network representing the entire nuclear energy and non-proliferation communities on Twitter (6000+ nodes and 200,000+ links) to the 19 most influential individuals within that network (See Figure 5). These individuals are the nodes that would be able to disseminate information to the majority of the network within a matter of hours.

Figure 5 (Image Source: Melonie Richey)
Identifying New Agents
Another traditional intelligence activity that could benefit from SNA is identifying potential new “agents” – people or organizations who might be willing or able to provide information to an intelligence agency.
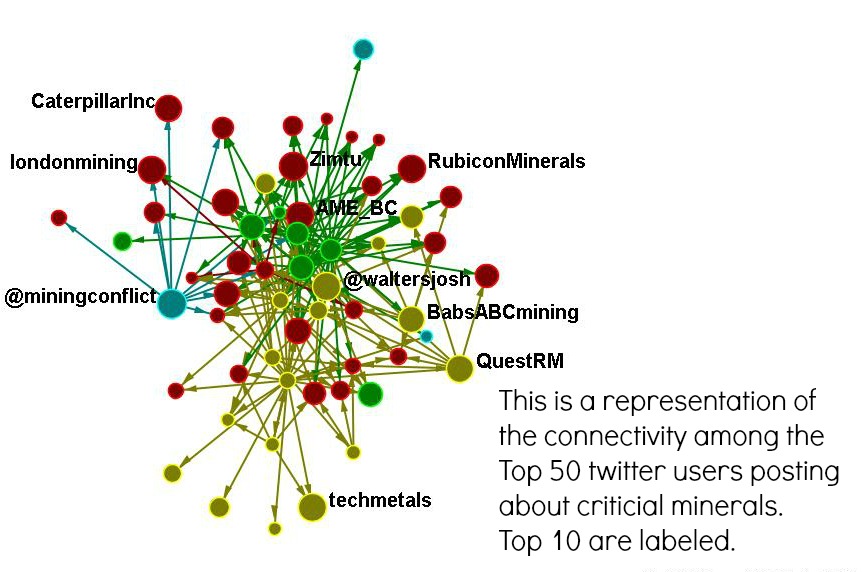
For example, by using Twitter’s list feature, which allows users to establish lists of people to follow for particular purposes, and some simple cross-referencing techniques, we were able to identify 50 new, highly reputable individuals and organizations talking about strategic mining and minerals on Twitter. [6]
(Actually, this is a typo.  Students in my Collaborative Intelligence class created this)
Figure 6 (Image Source: Melonie Richey)
While such a use by intelligence agencies may seem Orwellian, it is similar to techniques currently used in business to identify potential customers.  Likewise, a similar algorithm likely supports various friend/colleague recommendation engines such as LinkedIn’s “People You May Know” feature.
Simulating Information Flows
Of all the capabilities of SNA, simulations are likely one of the most useful. Carnegie Mellon’s ORA, for example, provides four main kinds of simulations in order to demonstrate how money, information, disease or technology would move through a network. Pathway simulations locate the most direct or indirect routes from one node to another. Still other simulations also indicate how a network would react to the removal of any particular node or set of nodes (for example, how a decentralized terrorist network such as the Taliban would function if the leaders from two key cells were killed).

Figure 7 (Image Source: Melonie Richey)
As an example of this feature, Figure 7, shows the effect of providing a highly relevant piece of information to the 19 individuals identified in the Twitter network of nuclear specialists discussed above.  The dots, representing individuals and organizations on Twitter, get larger and change color as the information flows throughout the system.  Variables within the simulation allow researchers to alter the level of interest the network likely has to a particular piece of information (the information’s “virality”).
Combining SNA with Other Methods
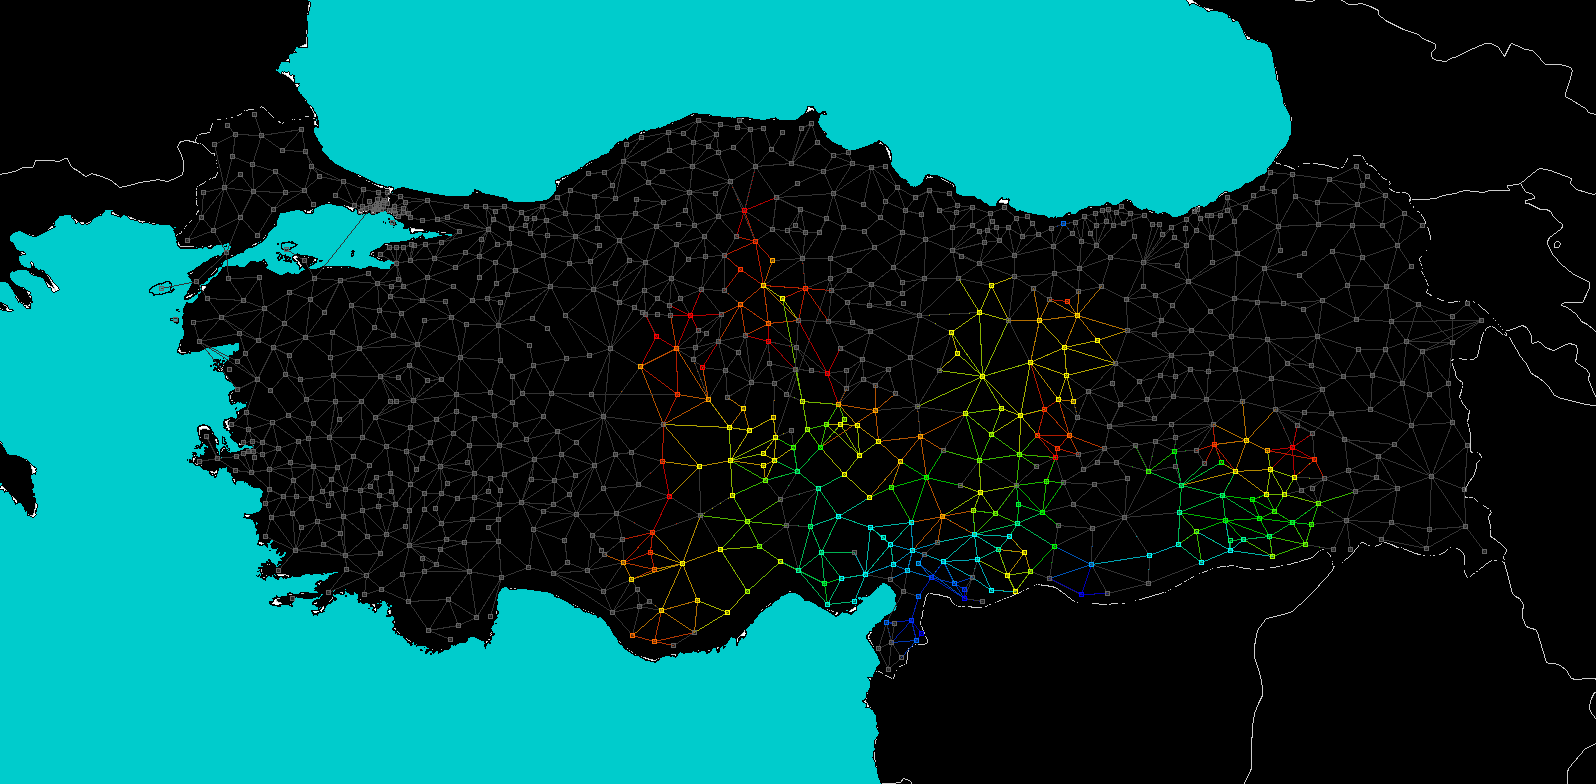
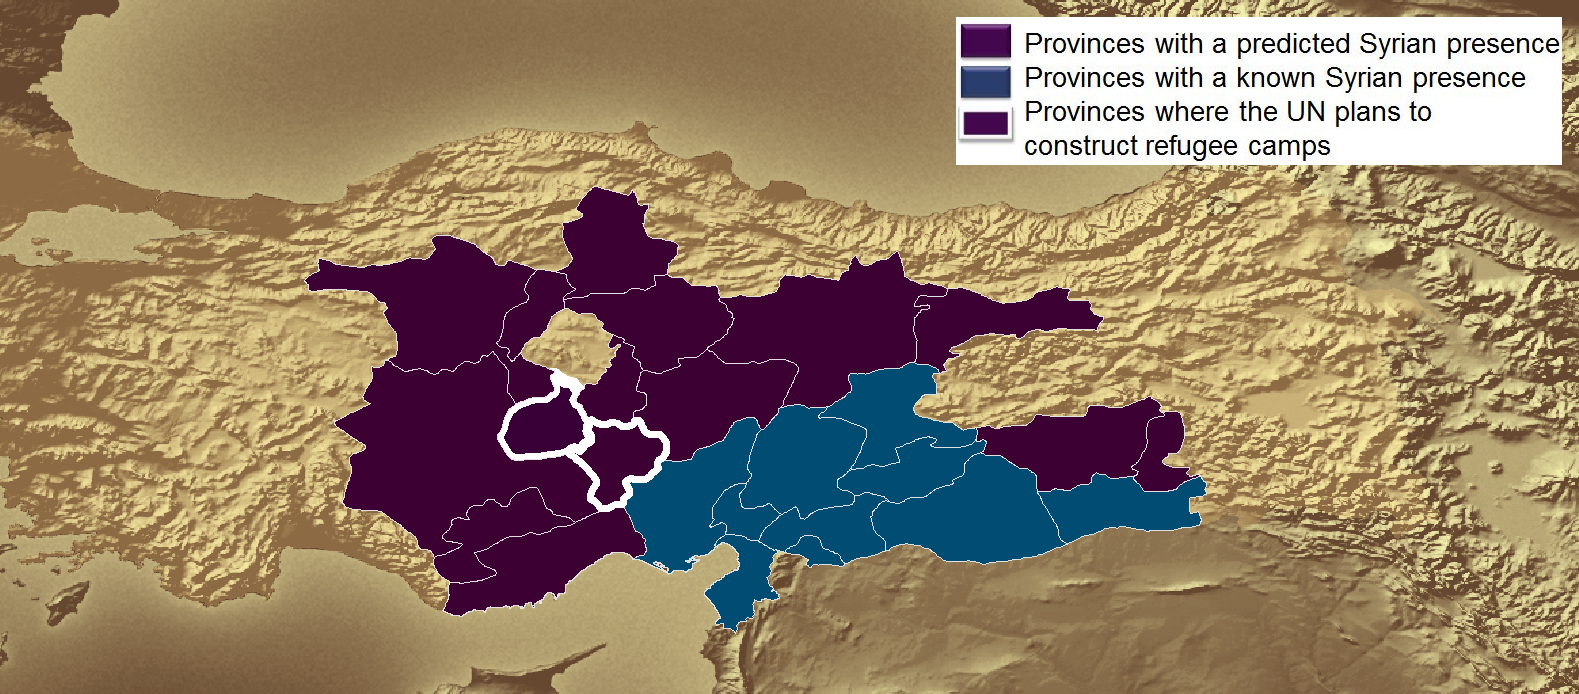
These simulations and other features of SNA provide idealized analyses that can then be combined with other techniques, such as GIS. Networks within ORA and many other SNA tools can be visualized geospatially if coordinates are provided for each node. Running simulations through these networks can then be represented on a map much like the simulation of Syrian refugee population movement throughout Turkey shown in Figure 8. This, in turn, allows for powerful predictive analytics. Figure 9 reflects the outcome of the simulation in Figure 8; not only does the image represent reality (the known locations of Syrian refugees according to the UN), [7] it also predicts where refugees are likely to move within the next 12 to 24 months. This analysis employed SNA as the cornerstone analytic technique in conjunction with GIS and even includes ideas from the more traditional intelligence methodology of Intelligence Preparation of the Battlefield.

Figure 8 (Image Source: Melonie Richey)

Figure 9 (Image Source: Melonie Richey)
Caveat Emptor
Like all analytic techniques, SNA is imperfect and comes with a number of caveats for researchers new to the method.  SNA, while widely applicable, is by no means universally applicable.
For example, in early 2013, one of the authors sought to use SNA to locate terrorists using social media. SNA and social media seemed like a good place to start, even though it seemed unlikely that many such individuals would self identify as a “radical extremist” or “Al-Qaeda affiliate.” Ultimately though, the effort failed because there was just too much of what social network analysts like to call “white noise,” or extraneous information picked up through a comprehensive scraping of the Internet. Our search for radical extremists returned journalists, university students of international relations and politics, and a slew of ordinary people just keeping up with current events and Tweeting about it.
Another issue with SNA has to do with the nature of relationships.  In the real world, they are often messy and convoluted.  Just because two people work together and do so often, does not necessarily mean that they like each other.  Similarly, the best way to describe the relationship between two businesses might not be the number of contracts the two have signed together.  SNA works best, however, with clearly definable relationships and where one factor in the relationship correlates well with other factors important in a relationship.  Modern intelligence problems, which often contain, political, economic, military, tribal, geographic, personal, and historical relationship data require the application of advanced SNA techniques and, even then, may yield little of real use to decisionmakers.
Finally, SNA is fundamentally a mathematical tool but is most useful in the decisionmaking process when the networks are visualized.  It is, without doubt, the visualization of these networks that tends to capture the most attention from the policymakers that intelligence units typically support.  This is both a blessing and a curse.  While it is easy to capture attention, explaining why the charts and graphs look the way they do is an art.  All too often, the initial excited reaction to these diagrams turns to boredom and confusion as analysts bog the decisionmakers down with the arcana of SNA.  In addition, creating these complex visualizations often stresses even the most powerful personal computers (the images of the simulation in Figure 8 above took approximately 2 hours to produce using a powerful desktop PC with two high end graphics cards).
Like every analytic technique, SNA has great utility for the right question. Within its limits, SNA is unmatched and can be usefully applied to identify key individuals or organizations within a network, generate new leads and simulate the flows of information or money throughout a network.  SNA, however, remains just an answer, not the answer.  Used inappropriately or without a full understanding of the limits of the method and analysts will only be finding new and more technically sophisticated ways to fail.  That, then, is the primary job of the modern day analyst: making the judgment call of which techniques to use and when.  Equally as important as knowing when to use SNA is knowing when not to use it.

[1] Machiavelli, N. (1515). Why the kingdom of darius, conquered by alexander, did not rebel against the successors of alexander at his death. InThe Prince Retrieved from http://www.constitution.org/mac/prince00.htm
[2] Rieder, B. (2012, March 19). Retrieved from http://thepoliticsofsystems.net/2012/03/
[3] Newman, M. (2009). Networks: an introduction. Oxford University Press, chap. 3.
[4] Costenbader, E., & Valente, T. W. (2003). The stability of centrality measures when networks are sampled. Social networks25(4), 283-307.
*ORA: Software. (2013). Available from Carnegie Mellon. Retrieved from http://www.casos.cs.cmu.edu/projects/ora/software.php
[6] For more information on how we did this analysis (and both the strengths and weaknesses of SNA as a tool for finding “agents”), see “The New HUMINT?”
[7] “UNHCR Turkey Syrian refugee daily sitrep.” UNHCR: The UN refugee agency, November 25, 2013.
[8] UNHCR: UN refugee agency, “Syrian refugee camps in Turkey.” Last modified: October 243, 2013. Accessed: November 25, 2013.
[9] Syria needs analysis project (SNAP), “Regional analysis Syria – Part II: Host Countries.” Last modified September 26, 2013. Accessed November 25, 2013.

Monday, January 6, 2014

New Counterterrorism Calendar Is Out!

The US National Counterterrorism Center (NCTC) publishes it counterterrorism calendar each year and the 2014 edition is now available for download!

This calendar is not your typical calendar for the new year, either.  It is chock full of information for the working analyst.  Everything from significant dates for various radical groups to background profiles on a number of terrorists to technical pages on various threat related topics are contained in this 164 page resource.  The NCTC will also be coming out with an interactive timeline map soon (for a look at last year's version, go here).

If you are not familiar with this document and have any interest in counterterrorism, you owe it to yourself to check it out!