Showing posts with label Turkey. Show all posts

Monday, March 3, 2014

What The Syrians Had To Say: Views from Istanbul (Part 5 Of A Multi-Part Series)

First of all, thank you to those who have stuck with us through this lengthy series on network analysis and Turkey. This will be the final installment, though the projects are still ongoing and the techniques still being refined and applied. 

Below are the stories from Syrians that have fled the country, collected by the author in January 2014. 

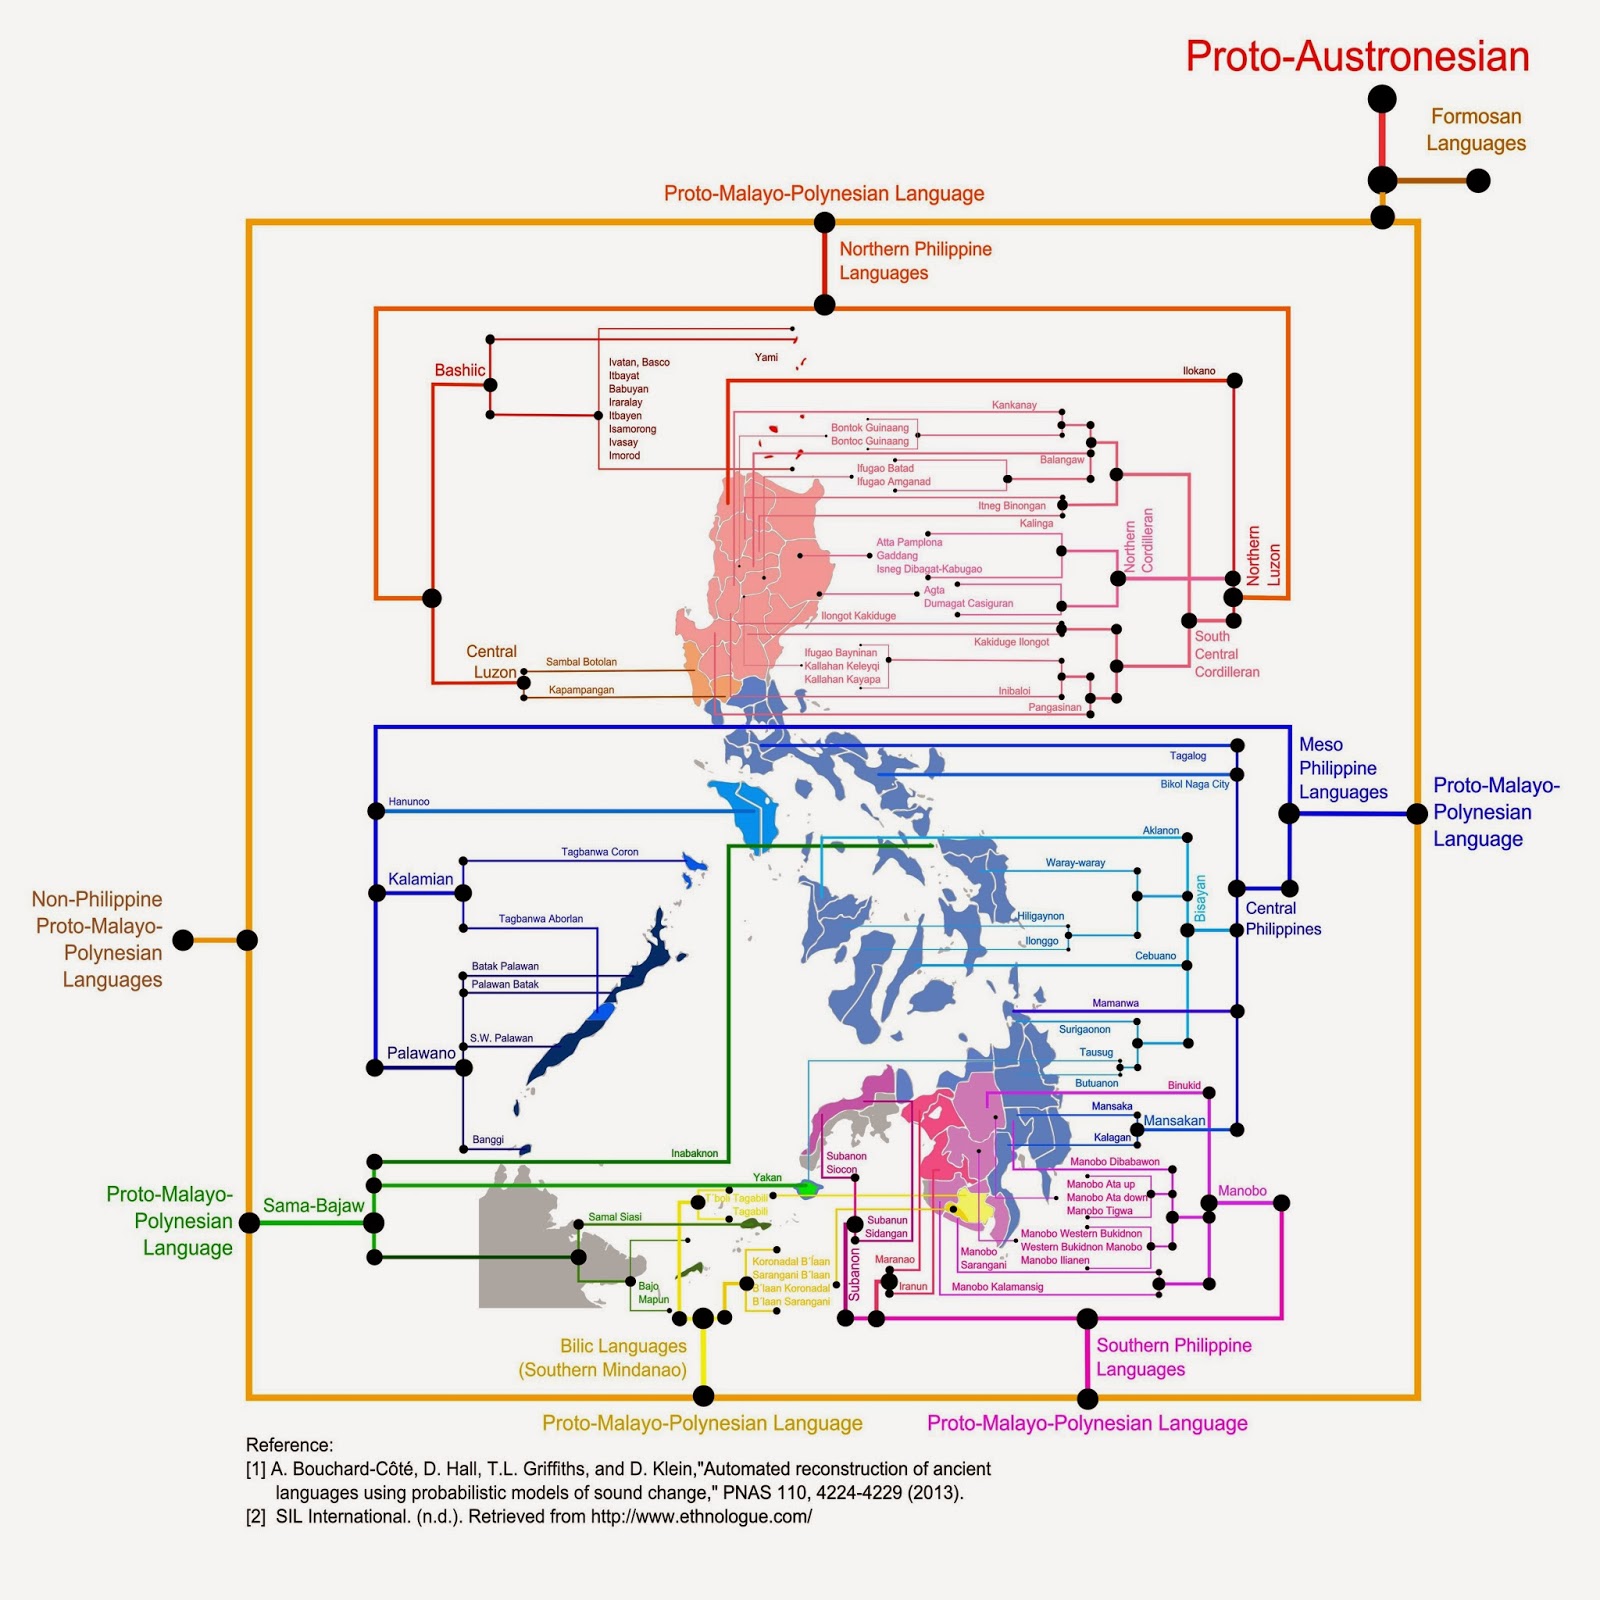
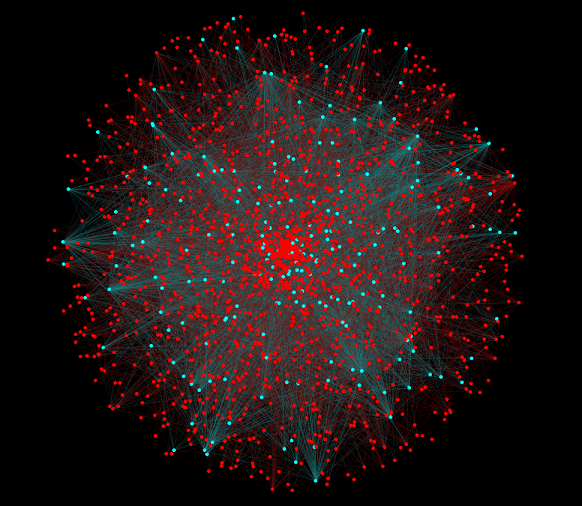
For those who missed the first four pieces, they can be found here: My Conversation With The Free Syrian Army, Ethnolinguistic Mapping, Gravity Model Analysis, and Population Simulations.

All the methodology involved in this lengthy project was recently presented at the International Network For Social Network Analysis Sunbelt Conference, and very well received (a big thanks to a very special CENTCOM Sunbelter who made the presentation and the trip to Turkey all possible). 

The methods led to very intriguing conclusions, some of which were confirmed and some of which were challenged by the Syrian refugee population in and around Istanbul, Turkey. In the suburbs of Istanbul, I spoke with many refugees to gain perspective on everything from their geographic movement to their political opinions, and what they had to say was equally as heartbreaking as it was informative. 

A woman held a one year, seven-month old child in her arms as she spoke to me in Arabic. "She is a living marker of the revolution," she told me. "She was just one month old when we left Syria; her life has only seen the war." 

Children playing outside for recess at a Syrian day school in Bayramtepe

A single mother of three, this woman had been living in an apartment in Fatih district of Istanbul since early 2013. The last time she had heard that her husband was alive after being incarcerated in Aleppo was March 2013. 

"We agreed before we left Syria," she said, "that if either one of us was killed or put in jail, the other one would continue to Istanbul." 

"Do you intend to stay in Istanbul?," I asked.

She replied that she could not leave. She hopes every day that her husband is alive, and if he is and escapes, he will only know to find her here. "I send money back to Aleppo for people to pay to the prison guards to ask about my husband. They take the money, but I never hear anything back." 

She was a woman of higher socioeconomic status, obvious from her black silk hijab. Many people living in Istanbul, namely the district of Fatih, are of a higher socioeconomic standing than those out in the suburbs, like Bayramtepe. 

Of all the people I interviewed, a total of 22 families and 152 individuals (about half of them children), there was a clear difference between groups of both lower and higher socioeconomic statuses. Those of the former group responded that they hoped to return to Syria as soon as possible. When asked what their ideal outcome would be, they replied that who would be in power in Syria did not matter, only that it was safe enough to return. 

Those of a higher socioeconomic status indicated that they did not intend to return to Syria. They were bitter and angry.

"Why would I go back?," one man shouted at me. "I have lost everything! There is nothing there for me and my family!"

"What would you like to see happen in Syria, politically," I pressed, despite his challenging tone. 

"Assad has treated the Syrian people like animals," he replied. He spoke of the need for international intervention. He expressed his disbelief at the U.S. government's lack of initiative in the region. "And this Geneva conference..." he continued, "they are just playing their game." He spit these last words at me before taking a sip of the Turkish tea his son's wife had made for us on arrival. 

This interaction was representative of the class divide among those with whom I spoke. 

The following day I walked through Bayramtepe, sun setting quickly around 1600 behind rolling hills littered with cinder blocks and the occasional haggard donkey. Crawling out of the muddy streets and up the cement stairs to a shack on stilts, I was overwhelmed with the smell of garlic and cooked greens as the door opened. A chorus of Salaam Alaikum filled the entryway as I pried my muddy boots off my feet for about the 20th time that day.

It was a single room with a drafty roof, but it was cozy, with a pot in the center that contained simmering green leaves. Many children, too many to count, ran in and out of the house as a woman, upwards of 95, tottered around yelling at them to keep quiet for the guests. She brought out an apple on a tray for the seven of us to share.

"We walked," she told me, "first from Damascus, then to Raqqa where we crossed the Turkish border at Tel-Abyad." 

"What was the most difficult part of your trip?," I asked. 

She mentioned walking all that way with all the children (more than 10) and her mother, who was ill (the 95-year old woman who was surprisingly lively and cheerful, excited to have company). 

"Also," she pressed on after she had contained her tears enough to continue, "when we crossed the border, the Turkish police caught us on the other side. None of us had passports, so they returned us back to Syria. We had to wait for them to leave before sneaking across the border the following night."

This was a common story I heard from the refugees. Almost none had passports or citizenship papers. Many were captured and returned to Syria, but then sneaked over the border later. 

"My life was saved by an American," a man later told me.

This was intriguing.

"I was captured near Aleppo by the Syrian government, and put in jail with my family. We stayed there for a few days until another man was put in jail with us. An American, I think. He spoke only in English. Later that day, I heard the military talking and the captured man was someone of great importance, so the Syrians took us all, my family and the man, and left us out in the middle of the country near Aleppo. They just drove away. I was lucky."

Thoughts of who this man might have been flashed through my mind. A journalist, perhaps? An international peacekeeper? Someone the Syrians did not want to be responsible for incarcerating. 
Bayramtepe, Turkey


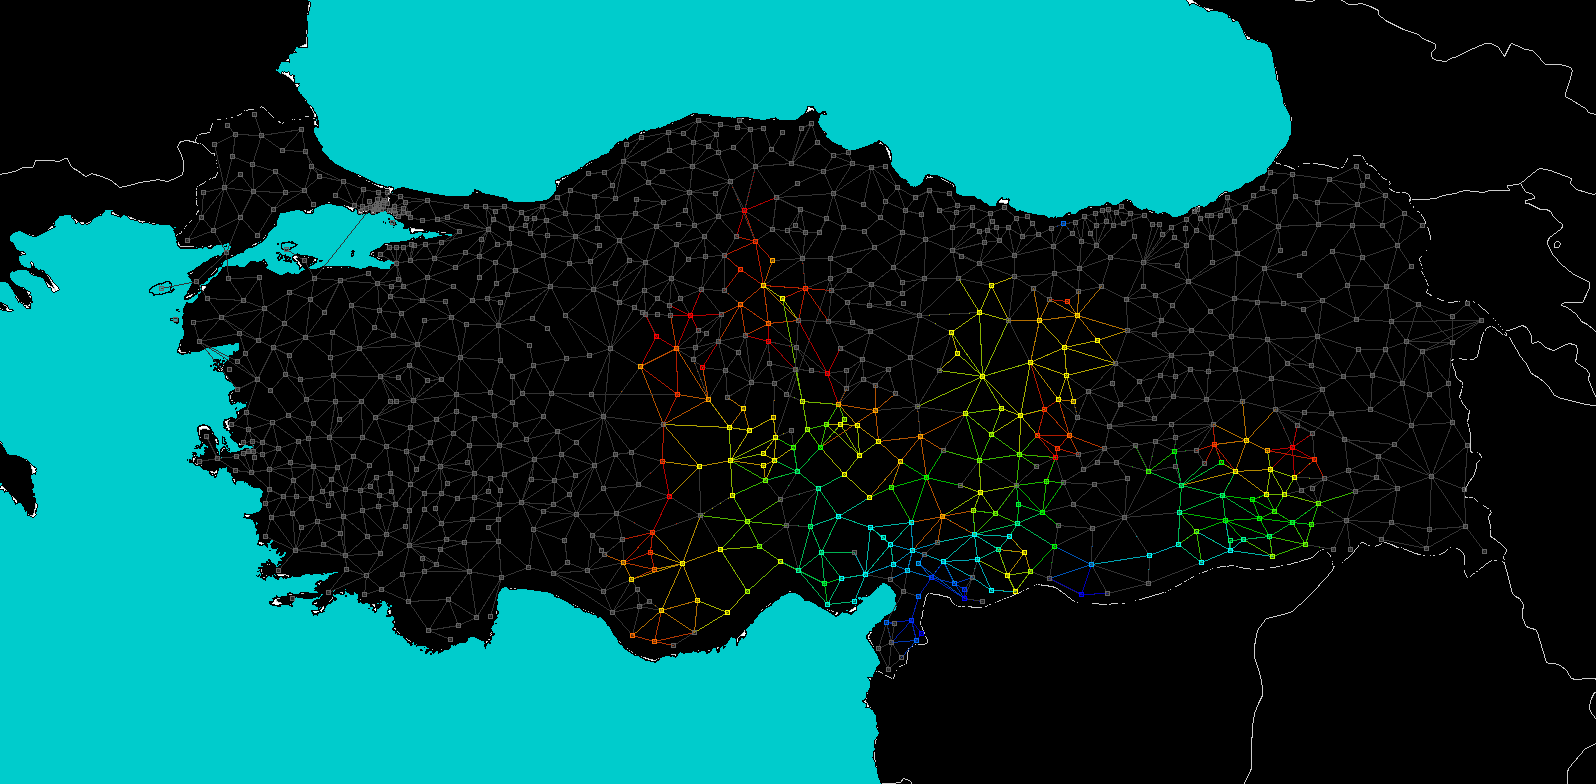
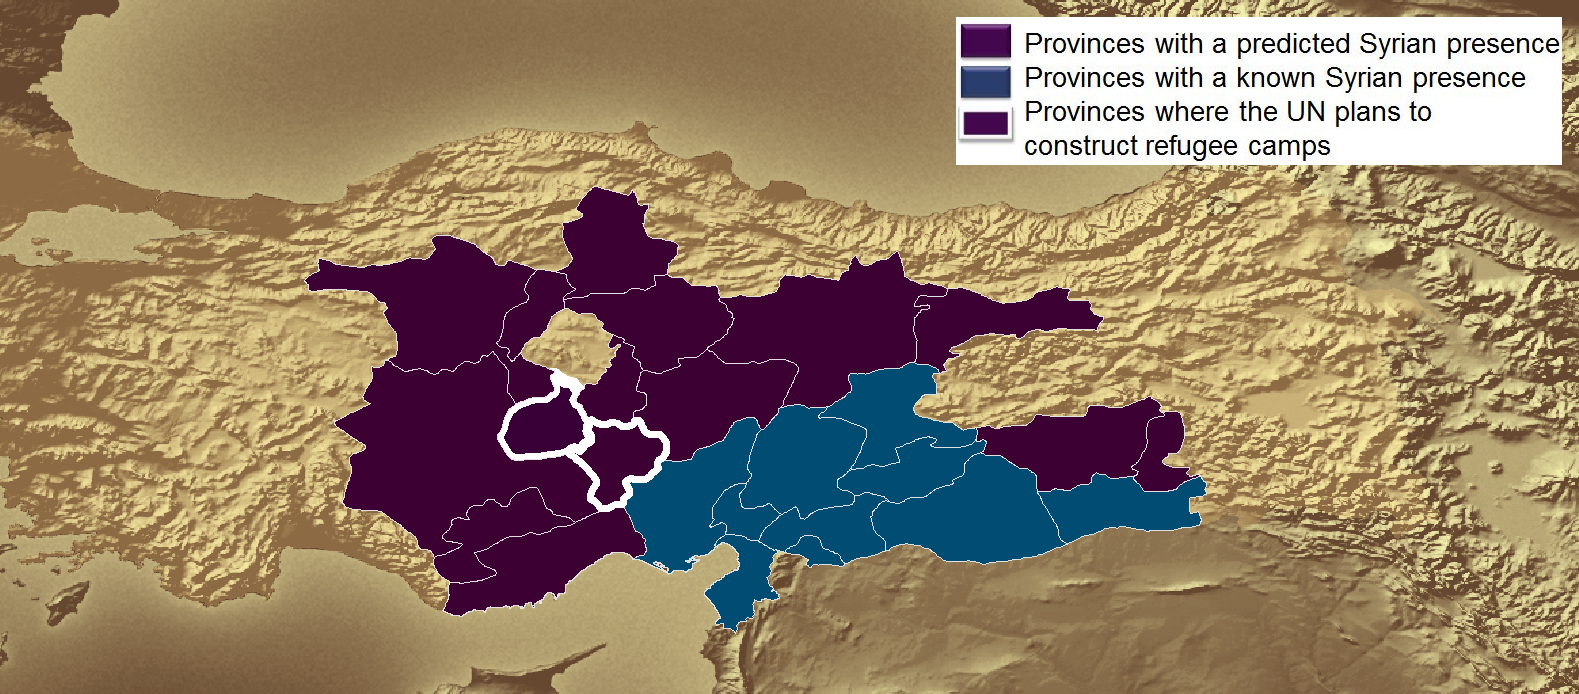
The refugees were from Aleppo, Raqqa, Homs, Idlib and Damascus. They had come to Istanbul looking for work, some by way of Cairo. It was encouraging to hear that those that had crossed the border between Syria and Turkey had all crossed at the precise locations used in my simulations. 

I also learned that most traveled on foot through Syria and then by bus from Turkish border towns to Istanbul. The factors in my simulation reflected railways and roadways. In retrospect, railways were unnecessary, where roadways were important, but so pervasive throughout such a developed country that the factor hardly would have made a difference. It is through these valuable insights that I can now alter the factors in the simulation to better represent the region hosting the population and the characteristics of the population itself. 

A final surprise from Istanbul was the groups of people that I encountered. I expected to find Shia Kurds, Christians and Alawites, all minorities in the Sunni Muslim refugee camps near the border. What I found were both Sunni and Alevi (Shia) Kurds, some Sunni Muslims and no Christians. Where were the Christians?

Granted, I had assumed they would be in Istanbul by process of elimination. They did not go to Jordan, Lebanon or Iraq, but preferred Turkey's more secular environment. They were not in the refugee camps near the border, though, so I assumed they must be among those migrating to Istanbul. After speaking with those who knew the entire Syrian population in Istanbul and its suburbs I determined there were no Christians in the area. Where were the Christians? News articles answered the question for me once I got home.

In speaking with a man named Azzad, the leader of a private Syrian refugee organization in Bayramtepe that survives on donations from Turkish citizens, he indicated that he had registered 2,500 families, upwards of 12,000 people, with 5 - 10 new families arriving daily. He said that no one leaves and everyone needs help. The majority of the refugees are Kurds.

A man named Muffa who runs the same kind of organization in Fatih district of Istanbul indicated he had 5,500 families in the city with 100 new families registering every month. 

"If I had to guess," he told me, "about 20 percent of the people in Fatih are Kurdish." 

These are just some of the many stories from the refugees that I spoke with representing the ways in which they challenged and confirmed my analytic predictions. 

While I continue to follow the crisis in Syria, my current research involves the application of the methods presented in this multi-part series to central Africa. The utility of the methodology developed is its flexibility, but different regions and refugee groups require a comprehensive re-evaluation of the factors influencing the simulation. 

With luck, look for the information on Central Africa to surface sometime early summer!

Monday, February 24, 2014

Syrian Refugee Population Simulation: From *ORA to Istanbul (Part 4 Of A Multi-Part Series)

Note: For those who haven't been keeping up with the most recent posts, this is part 4 of a fairly extensive series on network analysis techniques and the human geography of Turkey. In case you missed them, the first three posts can be found here: Part 1 (The Free Syrian Army), Part 2 (Ethnolinguistics of Turkey), Part 3 (Borrowing Analytic Techniques: Populations, Predictions And What Physics Tells Us About The Movement Of Alawites).


Figure 1. Simulating Population Movement
Source: CASOS *ORA Software
No competent analyst today can brief the situation in Turkey without at least mentioning the now 1 million refugees flowing across the porous border with Syria. 

My ethnolinguistic project was no different.  I quickly realized that I would have to do far more than "at least mention" the current crisis in Syria.  In fact, it quickly became the focal point of the investigation.  

Conceptually, the problem was simple. 

How to turn Turkey, a 1000 mile-long country with 81 provinces and 957 districts, into a network. Why did I want to make it a network? So I could use it as an architecture through which I could simulate refugee population flow. 

And the answer is going to surprise you (I know it surprised me).

If you are a tabletop wargamer, you will likely already have an answer to this. Ever played Showdown? Then you know what I'm talking about. 

For those unfamiliar with classic tabletop wargames, they tend to overlay hexagonal grids onto geographic landscapes in order to create a game board. Showdown turns the India-Pakistan border, for example, into a hexagonal grid system on which players explore the possibilities surrounding a hypothetical, near-future, nuclear Indo-Pakistani war.

Intelligence analysts also have a way of assessing terrain of strategic importance within the context of war: The well-known analytic method Intelligence Preparation of the Battlespace. With this method, intelligence analysts look at everything from climate to elevation to road/rail infrastructure to land cover/use in order to determine the most strategic plan of attack or invasion. 

Finally, brilliant scientists are using a methodology similar to mine in South Africa to predict elephant migratory patterns and calling it "resistance mapping." [1]

I, however, wanted to take a more organic approach to building the network architecture. And what better way to do so than to use the pre-existing administrative boundaries of Turkey? (A particularly ironic decision given that the original goal of the project was to replace all administrative boundaries with ethnolinguistic ones). 

This is when the 957 districts of Turkey because 957 nodes in a network, and the two to seven district border crossings for each of these 957 districts became a link in the network. It looked something like Figure 2. 

Figure 2. Derived Turkey Network
Source: CASOS *ORA Software and ArcGIS

Now that the nodes and links were established, there was the issue of link weights (if all links were weighted equally, the simulation would spread through the network equally in all directions, and that would be rather useless and not very predictive). 

The link weights were derived for each district border crossing from six factors on a scale of one to three. The factors were a combination of the ethnolinguistic mapping, the gravity model analysis and IPB factors:


     1. Terrain

     2. Roadways

     3. Railways

     4. Expanding, neutral or decreasing ethnolinguistic group

     5. Pre-existing Syrian refugee presence

     6. Gravity model output (influence on area from abroad in the next 12 - 24 months)

A higher link weight was indicative of increased difficulty a refugee would experience in moving from one district to the next. A lower link weight indicated that the route would be easier to navigate for reasons reflected in the factors above. [2] 

The simulation began in the five nodes representative of the seven most frequently-trafficked border crossings as determined by the UN. [3] It iterated 19 times and moved through Turkey revealing some encouraging findings along the way (See Figure 3). 

Figure 3. Simulated Syrian Refugee Population Movement Prediction Over 19 Weeks
Source: CASOS *ORA SOftware

Figure 4. Known Syrian Refugee Presence in Turkey
Source: UNHCR (November 2013)

Figure 5. Known locations of Syrian refugees. Size of dot indicates number of camp inhabitants.
Source: UNHCR (November 2013)
An important element in validating the simulation is analyzing the degree to which it tracks with reality. The simulation ran directly from the border districts between Turkey and Syria and tracked with the known locations of Syrian refugees (See Figures 4 & 5).  When the image of the known locations is overlaid with the image of the simulation it looks like this:

Figure 6. Simulation Overlay on Known Syrian Refugee Presence 
The two provinces outlined in white (Nigde and Aksaray) are where the Turkish government subsequently indicated that it would construct new refugee camps to relieve camps operating at capacity within the region. More confirmatory evidence. 

Now fast forward to two months later. The date is 18 February and, according to the UNHCR, the refugee population has moved further into the provinces indicated in Figure 7. Reality is unfolding within the lines of the simulation from which analytic predictions were drawn back in December 2013. 

Figure 7. Starred Provinces (Left to Right): Konya, Karaman, Mersin, Batman
(Yes, that is correct, there is a Turkish province called Batman)
All of this, from methods and process to final product analysis, led me to Istanbul (or just outside, as it were) where stories from Syrian refugees both challenged and confirmed my predictions. 

Be sure to check out the next installment, What The Syrians Had To Say: Views from Istanbul.

***

[1] The article, Computational Tools in Predicting and Assessing Forced Migration, employs much the same methodology as my approach, but utilizes an artificial hexagonal grid as opposed to the more organic network architecture that I used. It is an excellent read!

Edwards, S. (2008). Computational tools in predicting and assessing forced migration. Journal of Refugee Studies21(3), 347-359.

[2] These numbers were later inverted for the purposes of the simulation as, in a network, a higher link weight value indicates a stronger relationship. The numbers were inverted so that, the lower the link weight, the more difficult it would be for a refugee to move there and the less likely the simulation would be to move into that region as a result.

[3] Five nodes represented seven border crossings because each node represented one district. Two of the seven most frequently-trafficked border crossings were located in the same district as another border crossing, therefore only five nodes were necessary. 

Tuesday, February 11, 2014

Borrowing Analytic Techniques: Populations, Predictions And What Physics Tells Us About The Movement Of Alawites (Part 3 Of A Multi-Part Series)

Note: This is the third part in a multi-part series covering an extensive project on the human geography of Turkey and network analysis applications within the field of Intelligence Studies. Be sure to read the first two posts, My Conversation With The Free Syrian Army and Turkey Redrawn.


World Migration into Turkey
Source: International Organization for Migration Map
In the past, SAM has covered many different Structured Analytic Techniques (SATs), the zooming technique and Structured Role Playing among them. This post covers an analytic technique somewhat unfamiliar to the intelligence discipline, but extremely useful, especially within the realm of human geography and population movement. 

Using this technique, I was able to make predictions that read something like this:

"The ethnolinguistic populations within Turkey that will likely expand within the next 12 to 24 months are Bulgarians, Serbs, Iraqi Kurds, Iranian Arabs and Azerbaijanis."
and...
"The groups that are highly likely to impact Turkey within the next 12 to 24 months are Syrians and Kurds (from Syria, Iraq and Iran)."
Where did these predictions come from?

Gravity models.


I know what you're thinking, and yes, gravity models do have to do with gravity and yes, gravity models do happily reside within the domain of physics. 


Now, before you close the page, I am not going to spend the next four hundred or so words discussing Newton's Law of Universal Gravitation. Instead, on a one-stop flight from physics to intel, we will have a brief layover in the discipline of economics.  


I said, don't close the page!

Back in the 1950s, economists began to import gravity models into economics to predict trade flows and it looked something like this:


F_{ij} = G \frac{M_i M_j}{D_{ij}}

Where F is the flow of bilateral trade between country Mi and country Mj (measured in economic size). D is the distance between these two countries in kilometers squared and G is a constant. If it seems familiar, it should.  It is Newton's Law with the names of the variables changed.

In the 1970s, a man by the name of Peter Trudgill, a well-respected British sociolinguist, brought the gravity models to dialect geography. Trudgill, whose most recent book was published in 2011, holds many firsts within the field of linguistics, of which gravity models are one. He enacted a series of alterations to the gravity model in order to account for linguistic factors, the end goal being to create gradient zones of gradual shift from one phonetic marker to the next within geographic space (like geospatially representing the line in and around Boston that marks where people stop saying cah and start saying car). Trudgill's gravity model looked like this:


Trudgill's modifications to the original gravity model accomplish two goals:
  1. By adding the s variable measured on a scale of one to four, he factors in the well-known assumption in sociolinguistics that contact occurs more readily between groups that have "prior-existing linguistic similarity." This means that if the languages spoken by Population i and Population j are mutually intelligible (such as American English and British English), the s variable would be higher than for, say, American English and Italian). 
  2. By adding the second half of the equation, he gives the model directionality. The original gravity model was intended to predict bilateral trade, meaning it would predict the economic contact between one country and another. Trudgill's model predicts the influence country Pi will have on country Pj as opposed to the bilateral contact country Pand country Pj  will have.
Now, what does all this have to do with intel?

Within the context of my most recent project, mapping the Syrian refugee population in Turkey, gravity models provided a way to analyze the ethnolinguistic landscape in Turkey through a predictive lens. Instead of saying, "Here are where Armenians live in Turkey," I can say, "Here are where Armenians live and this is how likely there are to be more Armenians traveling to this region from Armenia in the next 24 months." 

In other words, it took the ethnolinguistic mapping project from descriptive to predictive

In order to achieve this, I added one more variable to Trudgill's altered gravity model: the c variable.


The c variable is a variable assessed on a scale of one to four that takes into account the trend line of migratory patterns from target ethnolinguistic groups over the past 10 years (data taken from the International Organization for Migration). In other words, to the degree that future migratory patterns follow historical trends for each ethnolinguistic group, the c variable takes these trends into consideration. 

What results from these models is an index score (usually a decimal) that is indicative of how likely or unlikely contact is to occur (or, in the case of some of the most advanced equations, how likely one region is to influence another region). This has the potential to  make a compelling predictive argument when translated onto a map (See Figure 1).
Figure 1. Results of gravity model analysis represented geospatially.
Green areas: Ethnolinguistic areas that are highly likely to expand in the next 12 to 24 months
Black areas: Ethnolinguistic areas that are likely to expand in the next 12 to 24 months
Click here for a map of all the ethnolinguistic areas of Turkey
These models have widespread application for predicting contact between any kinds of populations, but arguably the circumstance in which gravity models work best are when a generally homogeneous geographic region hosts pockets of ethnic diversity. Such is the case with Turkey, therefore gravity models provided a solid predictive approach. 

Gravity models were the backbone of my ethnolinguistic predictions regarding Turkey. It is the output of these models that got me to thinking about the incoming Syrian refugee population which, at the time, numbered close to 700,000 and today likely exceeds 1 million. 

With that in mind, don't miss the next post (by far the most interesting): Syrian Refugee Population Simulation: From *ORA to Istanbul.

Monday, February 3, 2014

Turkey Redrawn: Ethnolinguistic Lines And Populations In Transit (Part 2 Of A Multi-Part Series)

Note: This is the second part in a multi-part series covering an extensive project on the human geography of Turkey and network analysis applications within the field of Intelligence Studies. Be sure to read the first post, My Conversation With The Free Syrian Army!


Turkey’s ethnic populations are, in a word, surprising. 

For example, one would expect that speakers of Azerbaijani residing in Turkey would speak Northern Azerbaijani from Azerbaijan.  Yet, according to Ethnologue, the Azerbaijani spoken within Turkey’s borders is Southern Azerbaijani from Iran. This begs the question: are the ethnic Azeris in Turkey from Azerbaijan or Iran? Or both? Of course, all Azeris are ethnically Iranian, and Northern and Southern Azerbaijani are mutually intelligible as far as languages go, but the fact remains that many many Azerbaijanis living in Turkey did not originate where the name suggests. 

The same is the case for the Kyrgyz speakers in Turkey who did not immigrate from Kyrgyzstan but were resettled in Turkey’s Kars province from the Wakhan Corridor of Afghanistan after migrating into Pakistan through the Hindu Kush in the early 1980s. 

Surprised? I'll admit that I was. 
Figure 1. Turkey Provinces by Population
Figure 2. Philippine Languages Map

When analysts look at a country, they tend to look at the lines that divide it. International borders, provinces, districts, regions, counties, states.  They serve as the architecture for how we come to understand a region in a defined geographic space. Turkey, for example, is a country comprised of 81 provinces and 957 districts (See Figure 1) that also plays host to the largest portion of the frequently-imagined Kurdistan in the southeast.

The human geography of Turkey, however, maps a different landscape than that dictated by provincial borders. Borrowing an idea from a Philippine Science blog (See Figure 2), I set out to make my own linguistic map of Turkey (See Figure 3). This map depicts an ethnolinguistically diverse country hosting five language families, over 30 living languages and over 30 minority ethnic populations (for a quick dive into Turkey's linguistic diversity, check out Ethnologue's Turkey page).
Figure 3. Linguistic Map of Turkey 
Figures 4 and 5 overlay these social and linguistically driven borders - borders which are truly more reflective of the internal population. Equally as important as recognizing these borders is understanding how they came to be the way the are (I again reference the resettlement of the Kyrgyz from Afghanistan). 

Figure 4. Ethnolinguistic Areas of Turkey


Figure 5. Ethnolinguistic Areas of Istanbul

What began as a geocultural mapping project of Turkey to fill a void in geospatial intelligence quickly evolved into population movement simulations referencing arguably the most prominent humanitarian crisis of today: The Syrian civil war. 

Why? 

Because no competent analyst can submit a report on minority ethnic populations of Turkey without at least mentioning the approximately 1 million Syrian refugees flooding into the country over the last 12 months (Hatay province was always a microcosm of Syria in Turkey; now that can be said for practically the entire southeastern border ... but more on that later). 

The point is that the population movement simulations were only possible with a comprehensive understanding of Turkey's ethnographic landscape in the form of a map which, surprisingly, did not exist prior to the undertaking of this project. 

Did any ethnolinguistic maps of Turkey exist? Sure. See Figures 6 and 7 for some of the better examples. But what did they use for resources? How comprehensive were they? How dated were they? These were the questions I asked myself before starting my own collection. 


Figure 6. Kurdish Language Map
Source: Geocurrents, a fantastic geolinguistics blog
Figure 7. Turkish Language Map
Source: Muturzikin, a Basque Linguistic Mapping Resource
To create my map of Turkey, I went to places some analysts would never go in the name of high source reliability: Blogs. Conducting an Internet deep dive, I looked at independent travel blogs (such as MiddleEastExplorer), organizations seeking to spread Christianity to non-Christian areas (such as The Joshua Project) and a host of sites for endangered languages and minority peoples (like Sorosoro and Linguamon). After all, a small Russian news organization covering a film crew's recent travel to Turkish Tatar villages to research an independent film, Halkim Minem, is as good a source as any to use to identify Tatar villages within Turkish borders. 

Using over 200 resources, albeit many with low source reliability, and taking all pre-existing ethnic maps of the region into consideration, I vetted, corroborated, re-vetted and combined everything I could find on all 30 ethnolinguistic groups in order to compile the most comprehensive and up-to-date ethnolinguistic map of Turkey currently available. 

Making an ethnolinguistic map of Turkey was my way of walking the battlefield in preparation for the bulk of the project, the simulation, which was yet to come. 

Next: Borrowing Analytic Techniques: Populations, Predictions And What Physics Tells Us About The Movement Of Alawites.


***

Below are some of the other maps generated throughout the ethnolinguistic mapmaking process. These maps provide ways of looking at the dynamic fluctuation of identified ethnolinguistic areas.
Ethnolinguistic Groups in Turkey According to Origin of Group.
Internal (from within Turkey) - Purple
External (Such as immigrant or diaspora) - Blue
Ethnolinguistic Groups in Turkey According to Direction
Expanding group - Green
Neutral group - Yellow
Decreasing group - Orange
Ethnolinguistic Groups in Turkey According to Language Status (Scale Provided by Ethnologue)
3 - "Wide Communication" - Dark orange
  4 - "Educational" - Light orange
5 - "Developing" - Yellow
6 - "Threatened" - Light green
7 - "Shifting" - Dark green

Tuesday, January 28, 2014

My Conversation With The Free Syrian Army (Part 1 Of A Multi-part Series)

Bayramtepe, Tekirdag, Turkey
I was sitting cross-legged on the floor of a two-room apartment filled with floor cushions and a series of bunk beds. Fifteen men between the ages of 22 and 30 stared back at me, some having just woken up, some smoking cigarettes, some waiting intently for me to speak, others merely staring off into the distance. Personal weapons were strewn around the room along with some clothes, everything from dirty socks to handguns.

If this were a chance encounter, I would have said all 15 of them were just like me. But that couldn't have been further from reality.

None of the men knew each other before coming to Bayramtepe (a little town approximately three hours west of Istanbul) from Syria. They all had different stories regarding how they came to be there. Six of them had jobs in factories. The others did not work. Some were from Golan Heights, others from Damascus, Latakia and Aleppo. Some had been in Istanbul for just a month where others had been there upwards of a year.


Bayramtepe, Turkey
They were former fighters in the Free Syrian Army (FSA), one of the leading opposition forces in the ongoing Syrian civil war. About half of them had defected from the Syrian military in order to fight with the FSA. All of them had given up the fight - at least for now. And all of them were in Istanbul hoping to find work.

What led me to Turkey is a long story about simulating refugee population movements, network analysis techniques and a distinct focus on the human geography of Turkey. Over the next several posts, I will seek to elaborate on the projects, the methods and the experiences that span the Syrian civil war and the role of social network analysis in intelligence analysis.

This first post, however, is about the people I met.


***


"What was a normal day like for you?," I asked.

A man who had been with the FSA the longest answered in broken English, "We mostly fought Hezbollah in Damascus. They were our main opposition. We lived normal lives, generally. Wake up, eat something, but sometimes, most days, we had to fight."

"Do you think you will ever go back to Syria?," I continued.


A shorter man with large green eyes who spoke the best English replied, "When al-Qaeda leaves, I will go back!"

Another man piped up from the corner in Arabic. 

"He says he could care less about al-Qaeda, but when Assad is gone, he will once again return to Syria," my translator told me.

The men all laughed.

"What did they say now," I asked.

"That you should deliver the message to President Obama," my translator replied.


***


These are only a few of the people and only one of the encounters that occurred during my recent trip to Turkey to interview Syrian refugees in the outskirts of Istanbul. A collector of stories, I spoke with 20 families and over 100 individuals in just three days, including defected Syrian military fighters, the directors of two independent Syrian refugee organizations, self-identified members of Al Qaeda as well as the Free Syrian Army fighters mentioned in this post. 

We told part of the story in our most recent article, The Potential Of Social Network Analysis In Intelligence, which we published online in the e-International Relations magazine and OODALoop

But there is much more.  


Next:  Turkey Redrawn: Ethnolinguistic Lines And Populations In Transit

Thursday, January 23, 2014

The Potential of Social Network Analysis in Intelligence

(In case you missed our most recent article over at e-International Relations or at OODALoop, we are reprinting it here!)

The legality of the National Security Agency’s (NSA’s) use of US citizens’ metadata to identify and track foreign intelligence organizations and their operatives is currently a subject of much debate.  Less well understood (and consequently routinely misreported) are the capabilities and limitations of social network analysis, the methodology often used to evaluate this metadata.

One of the first causes of confusion is definitional.  Social network analysis is often linked to an inappropriate degree with social media.  True, social media such as Facebook and Twitter are frequently used as rich data sources for social network analysis, but understanding the importance of networks in the affairs of states has been around at least since Machiavelli.[1]
In addition, the first modern version of what would come to be called social network analysis was developed not by an intelligence agency or computer scientist but by Columbia professor and psychosociologist, Jacob Moreno, in 1934.  These “sociograms,” as Moreno called them were used to graph individual preferences or relations within a small group.
Little did Moreno suspect that his method for understanding the relationships between people, when combined with graph theory and the processing power of computers, would allow for the detailed analysis of thousands of people or organizations with hundreds of thousands of connections between them (See Fig. 2). [2]

Figure 2 – Modern social network analysis uses powerful computers and graph theory to map out the relationships between thousands of nodes and hundreds of thousands of links. Shown here is the network of the over 6000 Twitter users who follow the Twitter handle of the American Nuclear Society along with their over 200,000 connections. (Image Source: Melonie Richey)
Along with the undeniable power of this type of analysis comes the inevitable (and justified) concerns for privacy and constitutionality.  But just how powerful is social network analysis?  What can intelligence agencies actually glean from the exabytes of data they are purportedly collecting?
Social Network Analysis, as an analytic method, has inarguable applicability to the field of intelligence and is progressively reshaping the analytic landscape in terms of how analysts understand networks. For example, analysts currently use SNA to identify key people in an organization or social network, develop a strategic agent network, identify new agents and simulate information flows through a network. Beyond this, SNA can be easily combined with other analytic practices such as Geographic Information Systems (GIS), gravity model analysis or Intelligence Preparation of the Battlefield (IPB) to create robust, predictive analyses.
Identifying Key People/Organizations in a Network
The most obvious use of SNA is its ability to identify key actors and entities within a network. Centrality measures within a network are means for measuring a node’s relative importance within the network. [3] It is well-accepted that “the ability to measure centrality in social networks has been a particularly useful development in social network analysis.”   What is more interesting, however, is the number of centrality measures that social network analysts use to reveal different things about how key actors interact within a network. [4] For example, a node with a high degree centrality is connected to many other nodes. In Figure 3 below, it is unsurprising that the American Nuclear Society (ANS) has the highest degree centrality in its own Twitter network.  However, a node with a high betweenness centrality is one that connects the cliques in the network.  Figure 4 shows the same ANS network, reconfigured and revisualized with an emphasis on betweenness, with a new node, Nuclear.com, emerging as the most important.

Figure 3 (Image Source: Melonie Richey)

Figure 4 (Image Source: Melonie Richey)
For example, by analyzing the network in accordance with different centrality measures and establishing filtering criteria (and using Carnegie Mellon’s ORA software), [5] we were able to reduce a network representing the entire nuclear energy and non-proliferation communities on Twitter (6000+ nodes and 200,000+ links) to the 19 most influential individuals within that network (See Figure 5). These individuals are the nodes that would be able to disseminate information to the majority of the network within a matter of hours.

Figure 5 (Image Source: Melonie Richey)
Identifying New Agents
Another traditional intelligence activity that could benefit from SNA is identifying potential new “agents” – people or organizations who might be willing or able to provide information to an intelligence agency.
For example, by using Twitter’s list feature, which allows users to establish lists of people to follow for particular purposes, and some simple cross-referencing techniques, we were able to identify 50 new, highly reputable individuals and organizations talking about strategic mining and minerals on Twitter. [6]
(Actually, this is a typo.  Students in my Collaborative Intelligence class created this)
Figure 6 (Image Source: Melonie Richey)
While such a use by intelligence agencies may seem Orwellian, it is similar to techniques currently used in business to identify potential customers.  Likewise, a similar algorithm likely supports various friend/colleague recommendation engines such as LinkedIn’s “People You May Know” feature.
Simulating Information Flows
Of all the capabilities of SNA, simulations are likely one of the most useful. Carnegie Mellon’s ORA, for example, provides four main kinds of simulations in order to demonstrate how money, information, disease or technology would move through a network. Pathway simulations locate the most direct or indirect routes from one node to another. Still other simulations also indicate how a network would react to the removal of any particular node or set of nodes (for example, how a decentralized terrorist network such as the Taliban would function if the leaders from two key cells were killed).

Figure 7 (Image Source: Melonie Richey)
As an example of this feature, Figure 7, shows the effect of providing a highly relevant piece of information to the 19 individuals identified in the Twitter network of nuclear specialists discussed above.  The dots, representing individuals and organizations on Twitter, get larger and change color as the information flows throughout the system.  Variables within the simulation allow researchers to alter the level of interest the network likely has to a particular piece of information (the information’s “virality”).
Combining SNA with Other Methods
These simulations and other features of SNA provide idealized analyses that can then be combined with other techniques, such as GIS. Networks within ORA and many other SNA tools can be visualized geospatially if coordinates are provided for each node. Running simulations through these networks can then be represented on a map much like the simulation of Syrian refugee population movement throughout Turkey shown in Figure 8. This, in turn, allows for powerful predictive analytics. Figure 9 reflects the outcome of the simulation in Figure 8; not only does the image represent reality (the known locations of Syrian refugees according to the UN), [7] it also predicts where refugees are likely to move within the next 12 to 24 months. This analysis employed SNA as the cornerstone analytic technique in conjunction with GIS and even includes ideas from the more traditional intelligence methodology of Intelligence Preparation of the Battlefield.

Figure 8 (Image Source: Melonie Richey)

Figure 9 (Image Source: Melonie Richey)
Caveat Emptor
Like all analytic techniques, SNA is imperfect and comes with a number of caveats for researchers new to the method.  SNA, while widely applicable, is by no means universally applicable.
For example, in early 2013, one of the authors sought to use SNA to locate terrorists using social media. SNA and social media seemed like a good place to start, even though it seemed unlikely that many such individuals would self identify as a “radical extremist” or “Al-Qaeda affiliate.” Ultimately though, the effort failed because there was just too much of what social network analysts like to call “white noise,” or extraneous information picked up through a comprehensive scraping of the Internet. Our search for radical extremists returned journalists, university students of international relations and politics, and a slew of ordinary people just keeping up with current events and Tweeting about it.
Another issue with SNA has to do with the nature of relationships.  In the real world, they are often messy and convoluted.  Just because two people work together and do so often, does not necessarily mean that they like each other.  Similarly, the best way to describe the relationship between two businesses might not be the number of contracts the two have signed together.  SNA works best, however, with clearly definable relationships and where one factor in the relationship correlates well with other factors important in a relationship.  Modern intelligence problems, which often contain, political, economic, military, tribal, geographic, personal, and historical relationship data require the application of advanced SNA techniques and, even then, may yield little of real use to decisionmakers.
Finally, SNA is fundamentally a mathematical tool but is most useful in the decisionmaking process when the networks are visualized.  It is, without doubt, the visualization of these networks that tends to capture the most attention from the policymakers that intelligence units typically support.  This is both a blessing and a curse.  While it is easy to capture attention, explaining why the charts and graphs look the way they do is an art.  All too often, the initial excited reaction to these diagrams turns to boredom and confusion as analysts bog the decisionmakers down with the arcana of SNA.  In addition, creating these complex visualizations often stresses even the most powerful personal computers (the images of the simulation in Figure 8 above took approximately 2 hours to produce using a powerful desktop PC with two high end graphics cards).
Like every analytic technique, SNA has great utility for the right question. Within its limits, SNA is unmatched and can be usefully applied to identify key individuals or organizations within a network, generate new leads and simulate the flows of information or money throughout a network.  SNA, however, remains just an answer, not the answer.  Used inappropriately or without a full understanding of the limits of the method and analysts will only be finding new and more technically sophisticated ways to fail.  That, then, is the primary job of the modern day analyst: making the judgment call of which techniques to use and when.  Equally as important as knowing when to use SNA is knowing when not to use it.

[1] Machiavelli, N. (1515). Why the kingdom of darius, conquered by alexander, did not rebel against the successors of alexander at his death. InThe Prince Retrieved from http://www.constitution.org/mac/prince00.htm
[2] Rieder, B. (2012, March 19). Retrieved from http://thepoliticsofsystems.net/2012/03/
[3] Newman, M. (2009). Networks: an introduction. Oxford University Press, chap. 3.
[4] Costenbader, E., & Valente, T. W. (2003). The stability of centrality measures when networks are sampled. Social networks25(4), 283-307.
*ORA: Software. (2013). Available from Carnegie Mellon. Retrieved from http://www.casos.cs.cmu.edu/projects/ora/software.php
[6] For more information on how we did this analysis (and both the strengths and weaknesses of SNA as a tool for finding “agents”), see “The New HUMINT?”
[7] “UNHCR Turkey Syrian refugee daily sitrep.” UNHCR: The UN refugee agency, November 25, 2013.
[8] UNHCR: UN refugee agency, “Syrian refugee camps in Turkey.” Last modified: October 243, 2013. Accessed: November 25, 2013.
[9] Syria needs analysis project (SNAP), “Regional analysis Syria – Part II: Host Countries.” Last modified September 26, 2013. Accessed November 25, 2013.